Many locations. Many tills. Many general managers who sent me their numbers on Monday: some as a spreadsheet, some as a screenshot, one as a WhatsApp voice message.
That was what managing locations looked like for me before I stopped solving the problem by hand. I helped build Mama Trattoria from zero to ten locations in Hamburg. And the more sites we added, the less overview I had. Not because the numbers were missing. Because they came in ten different formats, at ten different times, with ten different interpretations.
Multi-location restaurant operations rarely fail because of missing data. They fail because the data is not comparable. This article shows how to run several locations so that deviations are on your desk the next morning, not at month-end in the P&L. It describes the daily routine; the KPIs, comparison rules and system requirements behind it are collected in managing multiple restaurant locations.
Contents
- The core problem: every location is a black box
- The 5 KPIs you need to compare per location
- Managing by exception instead of averages
- Why benchmarking between locations beats industry comparisons
- Model case: 10 locations, one overview, 5 minutes
- The most common mistakes in multi-location management
- FAQ
- Your next step
The core problem: every location is a black box
Imagine you run five restaurants. Three are doing well, two are struggling. You see that at month-end in the P&L. But why exactly location 4 has a labor cost percentage of 36% while location 2 is at 29%, you only find out when you put the rotas, the sales curves and the weather data side by side.
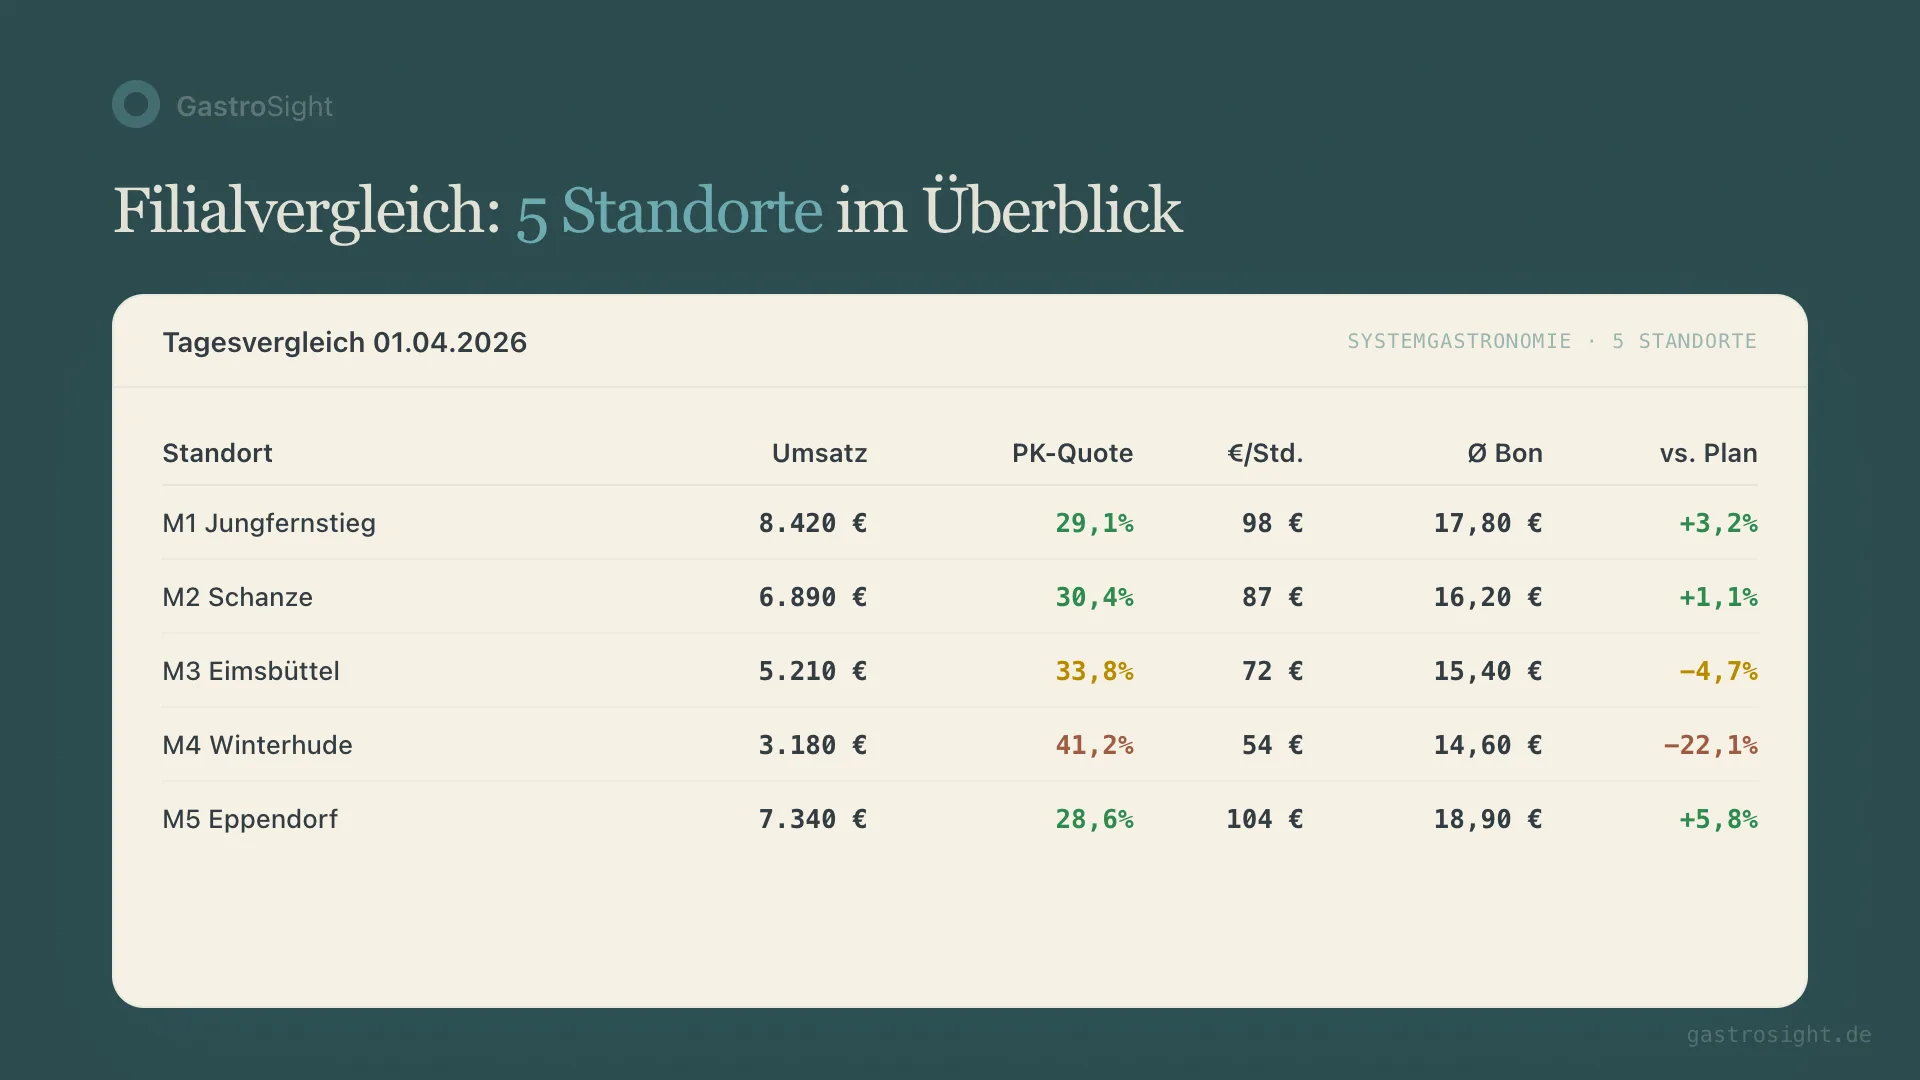
That takes time. For me it was three hours a week just to make the locations comparable. Not to make decisions, only to create the basis for them.
The problem is structural. In most multi-location businesses the data already exists:
- The POS delivers sales, checks and item sales
- The scheduling tool knows planned and actual hours
- The accounts hold food cost and fixed costs
But these three systems do not talk to each other. Each delivers its own truth, in its own format, at its own time.
The result: you are not running your locations. You are collecting reports and hoping nothing slips through.
The 5 KPIs you need to compare per location
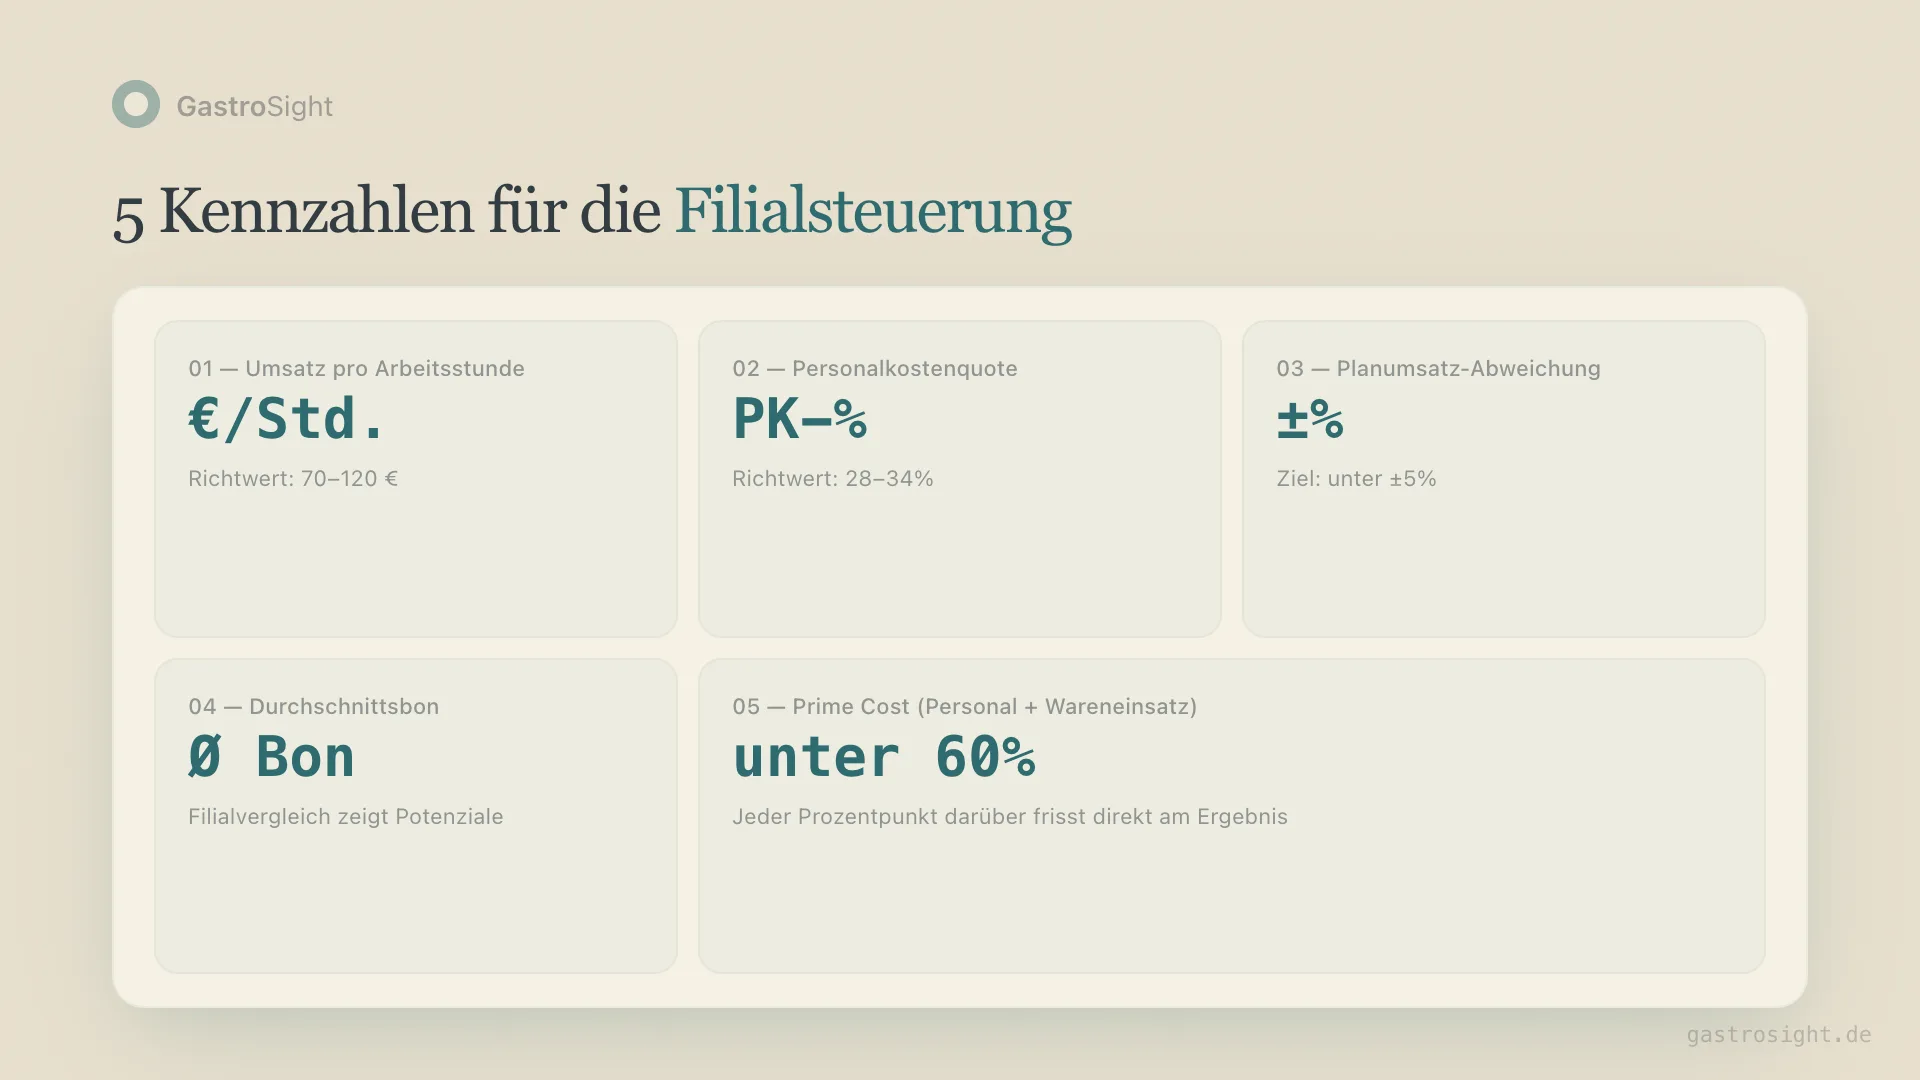
Not every KPI is suitable for comparing locations. What matters at company level can be misleading at location level. These are the five values that make the biggest difference in daily management:
1. Sales per labor hour
The most honest KPI in hospitality. It links sales to staffing and shows how efficiently a location works. Two restaurants with the same sales can differ by 40% on this value, because one team is scheduled too large.
Benchmark for multi-unit chains: €70-120 per labor hour, depending on the concept.
2. Labor cost percentage
The classic, but with one caveat in a location comparison: the labor cost percentage alone does not tell you whether a location has too many staff. It can also mean sales have collapsed. So always look at it together with the absolute number of labor hours.
Benchmark: your own trend per location and week. For reference, the latest official figure for Germany (Destatis, 2024) is 32.8% personnel expenses in restaurants, bars, snack bars and cafés (our own calculation from personnel expenses and sales). A sustained rise compared with your own figure for the previous year is a signal.
3. Deviation from planned sales
How close are actual sales to planned sales? This KPI shows two things: how good your forecast is, and whether external factors (weather, events, roadworks) have hit.
If location 7 is regularly 15% below plan, you do not have a location problem. You have a forecasting problem.
4. Average check
Compare the average check between locations to spot upselling potential. If location 3 has an average check of €18.50 and location 8 is at €14.20, with the same concept, there is a service, menu or training issue behind it.
5. Prime cost
Labor cost plus food cost, divided by sales. The most important KPI for profitability. In multi-unit chains, prime cost should be below 60%. Every percentage point above that comes straight off the bottom line.
Managing by exception instead of averages
Most multi-location reports show averages. Total sales, average labor cost percentage, average food cost. The problem: averages hide the outliers.
If three of your ten locations have a labor cost percentage of 28% and two are at 39%, the average report says 31%. Looks fine. It is not.
Multi-location management works through deviations. You do not need reporting that tells you everything is in the green. You need a system that tells you in the morning: location 4 had a labor cost percentage of 41% yesterday. The target is 31%. The deviation comes from 14 unplanned overtime hours in service.
That is the difference between reporting and management. Reporting documents. Management shows you where you need to step in today.
In concrete terms:
- Daily: which location deviated from plan yesterday? By how much?
- Weekly: which location has a pattern? (Always below plan on Mondays, always overstaffed on Fridays)
- Monthly: which locations are improving, which are getting worse?
If you cover these three levels properly, you no longer need a month-end crisis meeting. You correct as you go.
Why benchmarking between locations beats industry comparisons
Industry association benchmarks are useful for positioning your concept. For daily management they are no good. Your locations share the same concept, the same menu, the same processes. If differences in labor cost percentage or average check still arise, they come from local factors: team composition, site factors, leadership quality.
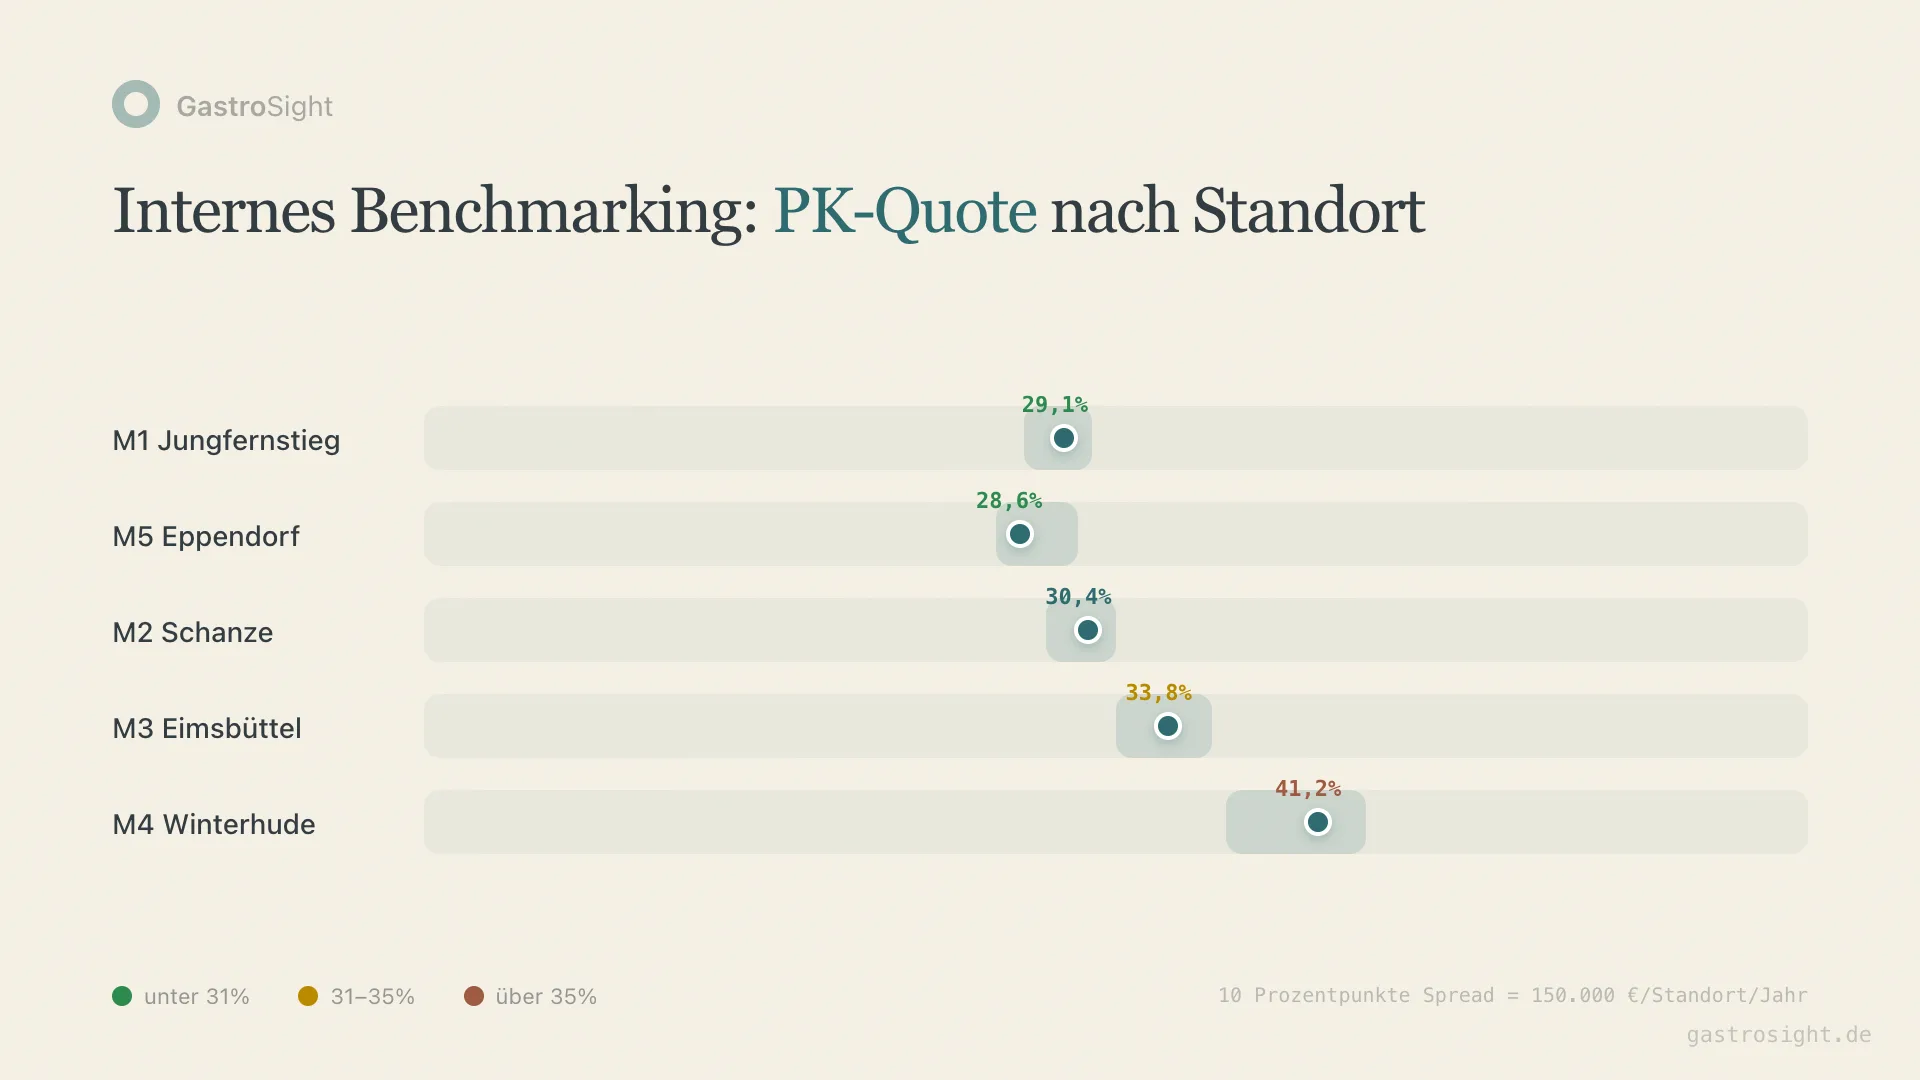
Internal benchmarking shows you:
Your best location as the reference. If location 2 consistently holds a labor cost percentage of 28%, that is your benchmark, not an industry table. The question then is: what does location 2 do differently? And can it be transferred?
The range of your performance. If your best location has a labor cost percentage of 28% and your worst 38%, that is a 10 percentage point spread with the same concept. At €1.5 million sales per location, 10 percentage points are €150,000. Per year. Per location.
Seasonal patterns compared. Some locations lose disproportionately in winter. Others keep their ratio stable. The comparison shows you which locations are weather-resistant, and why.
This works because you are comparing like with like. Same brand, same concept, same standards. Differences can therefore be explained and fixed.
Model case: 10 locations, one overview, 5 minutes
Here is what a typical morning with central multi-location management looks like. The numbers are a model example for a business with 10 locations, not real operating data.
6:30am: the briefing is in your inbox. A summary of yesterday's performance across all 10 locations. Not a 20-page report. One page. Locations with deviations are at the top, sorted by urgency.
The briefing says:
- Location M4 was 22% below planned sales. Reason: burst water pipe, closed from 7pm.
- Location M7 had a labor cost percentage of 38.4% on planned sales. Reason: three overtime hours in service, two of them unplanned.
- Location M9 had an average check of €13.80, €3.20 below the average of all locations.
Three pieces of information. Three concrete actions. M4 is an external factor, not a management issue. M7 needs a conversation with the general manager about rota accuracy. M9 needs an analysis of service performance.
That takes 5 minutes. Not because the data is simple, but because it arrives pre-structured. The POS delivers sales automatically. The scheduling tool delivers the hours. A dashboard brings both together and calculates the deviations.
Without that structure, at 6:30am I would have started opening 10 daily reports, cross-checking 10 rotas and consolidating 10 sales lists. That was my morning before I automated it.
The most common mistakes in multi-location management
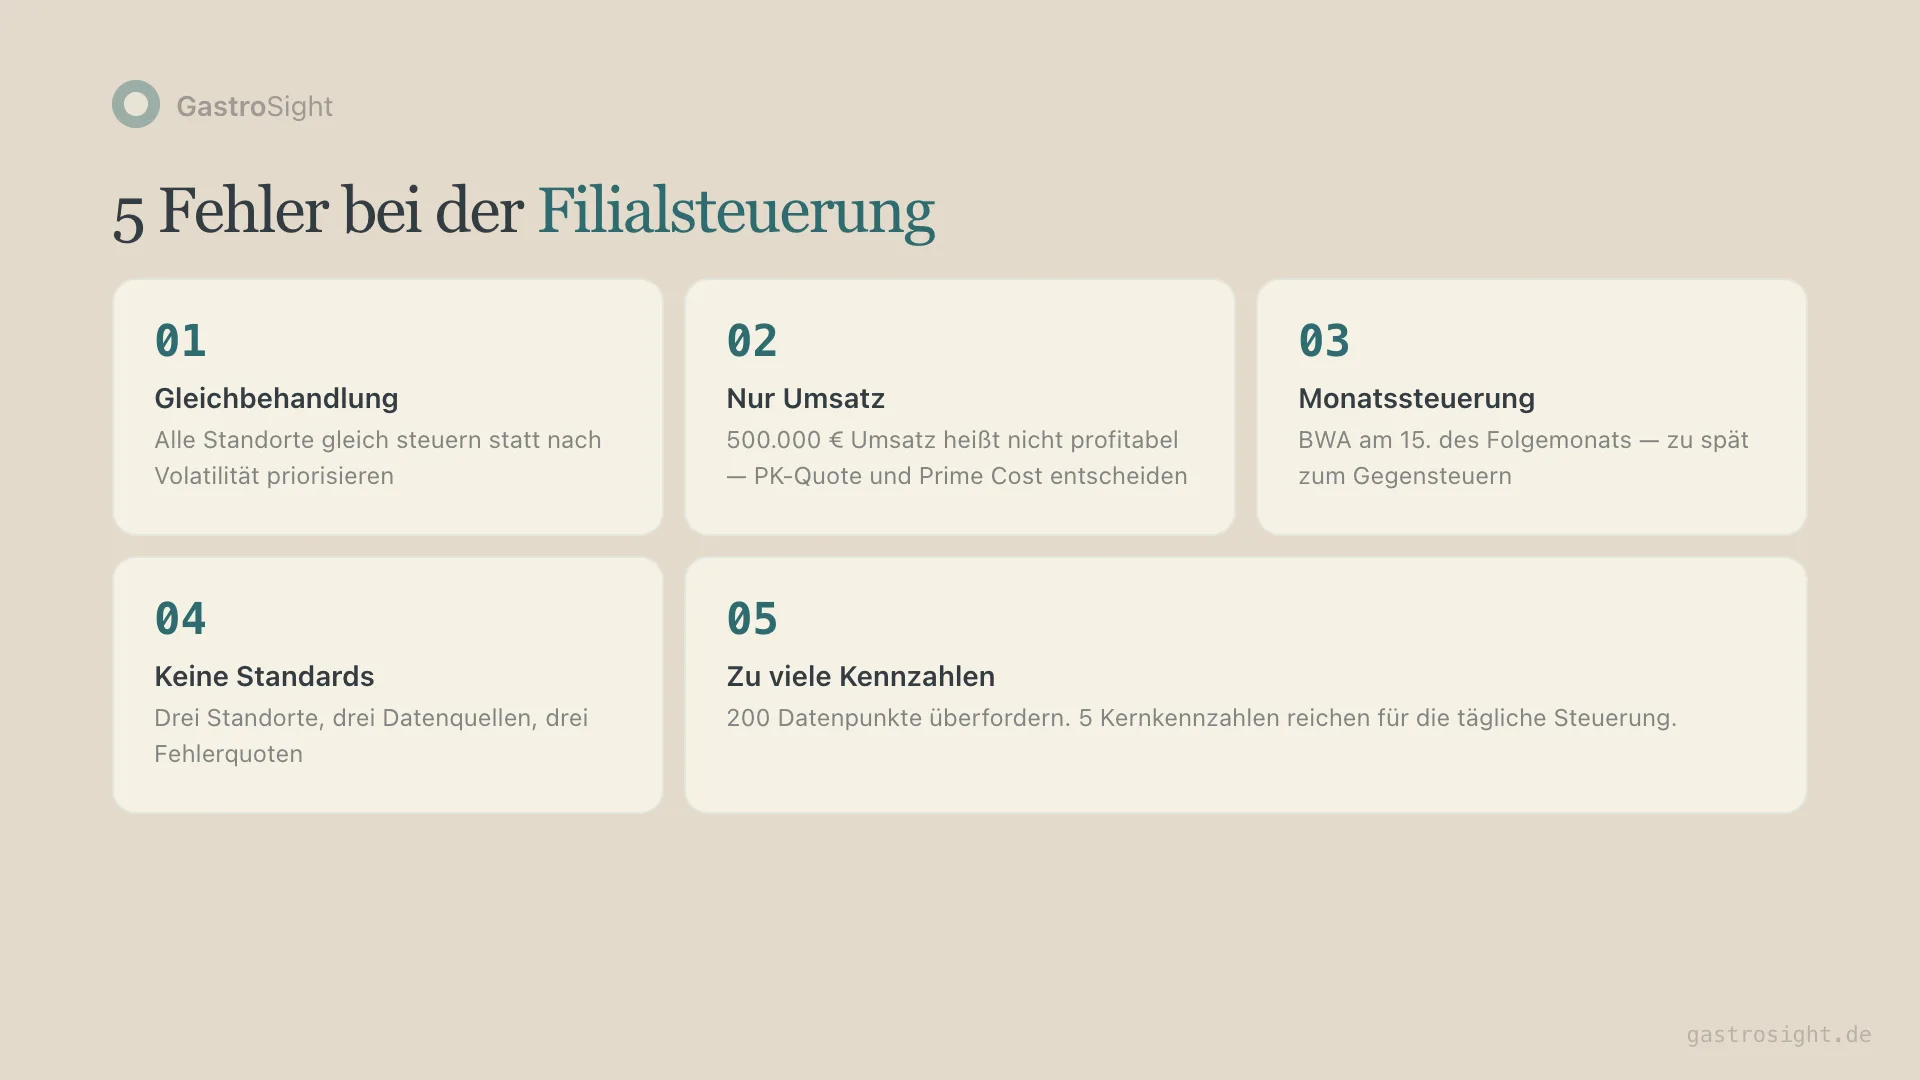
Mistake 1: treating all locations the same
Not every location needs the same attention. A location with stable KPIs needs a weekly review. A location with high volatility needs daily control. If you treat them all the same, you waste time on the good ones and miss problems at the bad ones.
Mistake 2: sales as the only management metric
Sales is a vanity metric. A location with €500,000 monthly sales can be less profitable than one with €300,000, if the first has a labor cost percentage of 38% and food cost of 32%. Manage by profitability, not by sales.
Mistake 3: monthly instead of daily management
The monthly P&L arrives mid-way through the following month. By then every deviation is history. You can analyse why February went badly. But you cannot get February back. Multi-location management only works in real time, or at least with daily data.
Mistake 4: no standardised data capture
If location 1 tracks its labor hours through the POS, location 2 through a time clock and location 3 in a spreadsheet, you have three data sources with three error rates. Before you compare locations, you need consistent data capture. Same systems, same definitions, same timings.
Mistake 5: too many KPIs, no prioritisation
20 KPIs per location, multiplied by 10 locations, gives you 200 data points. That overwhelms any reporting and any decision-maker. Focus on the 5 core KPIs and only dig deeper when deviations show up there.
From analysis to action
What this is about: a daily KPI and escalation workflow for location managers.
Put it into practice: Central multi-location management with Kiosa One View
More on Managing multiple locations
- Multi-Unit Restaurant Management: A Guide for Restaurant Groups
- Restaurant Location Benchmarking: Compare KPIs Fairly
- Restaurant KPIs: 8 Metrics with Formulas, Rhythm and Examples
FAQ
From how many locations do I need a central management tool?
From three locations, manual consolidation becomes a time sink. From five, it is no longer reliable. The error rate in manual spreadsheet reports rises with every additional location.
How often should I compare location KPIs?
Daily for operational KPIs (sales, labor cost percentage, average check). Weekly for patterns and trends. Monthly for strategic assessments (location profitability, investment decisions).
What is the difference between multi-location management and multi-location controlling?
Controlling documents what happened. Management uses that data to step in actively. A good management system does not just show you the deviation; it gives you the context (why?) and a recommendation (what to do?).
Which systems do I need to connect?
At least two: the POS system (sales, checks, items) and the scheduling tool (planned and actual hours, costs). The cost side from the accounts (fixed costs, monthly P&L) comes from your accountant. Optional: a weather provider (for forecast deviations) and review platforms (for tracking quality). With Kiosa you read POS data (OktoPOS, Hypersoft) and labor data (gastromatic, e2n, ordio) directly; details are under integrations.
Can I compare locations with different concepts?
To a degree. The labor cost percentage of a fine dining concept is structurally higher than that of a quick-service restaurant. Within the same concept type, the comparison works. Across concepts you need normalised values or separate benchmark groups.
Your next step
You run several locations and recognise the problems in this article? Then do not start with a new dashboard. Start with a question: do you know today which of your locations did worst yesterday, and why?
If the answer takes longer than 30 seconds, you have a management problem. Kiosa solves exactly that: all locations in one overview, deviations the next morning, context instead of raw data. For businesses with 3 to 50 locations. What this looks like for businesses with a single, standardised concept is described on the software for quick-service and multi-unit restaurants page.
Related terms
- Labor cost ratio: labor cost relative to sales
- Contribution margin: sales minus variable costs as a cross-location management metric
- Anomaly detection: automatic detection of unusual deviations per location
