Thursday evening, 9:30pm. Four servers are standing behind the bar. Two guests are sitting in the restaurant. The general manager built the rota from last week's, but last week had a public holiday, and this Thursday it has been raining since 2pm.
Result: €180 in labor cost for an evening that brings in €340 in sales. A labor cost percentage of 53% for that shift. This does not happen once. It happens every week, in thousands of restaurants.
Staff scheduling connects service capacity and labor cost. How big the economic lever is depends on the sales profile, pay structure, opening hours and your current planning process; a blanket margin effect cannot be promised in good faith.
Contents
- Why most rotas burn money
- Schedule by sales instead of copying
- The 4 biggest shift planning mistakes
- Calculating shift staffing: the formula
- Forecast meets rota: data-driven scheduling
- Staff scheduling and labor cost percentage: the direct link
- FAQ
- Your next step
Why most rotas burn money
I ran restaurants for 15 years. In that time I saw hundreds of rotas built on the same principle: copy last week, adjust where someone is on holiday. Done.
The problem: last week is not this week. Restaurant sales swing by 20-40% between individual days. Monday brings in 60% of Saturday. A rainy Wednesday brings in 30% less than a sunny one. But the rota looks the same for both days.
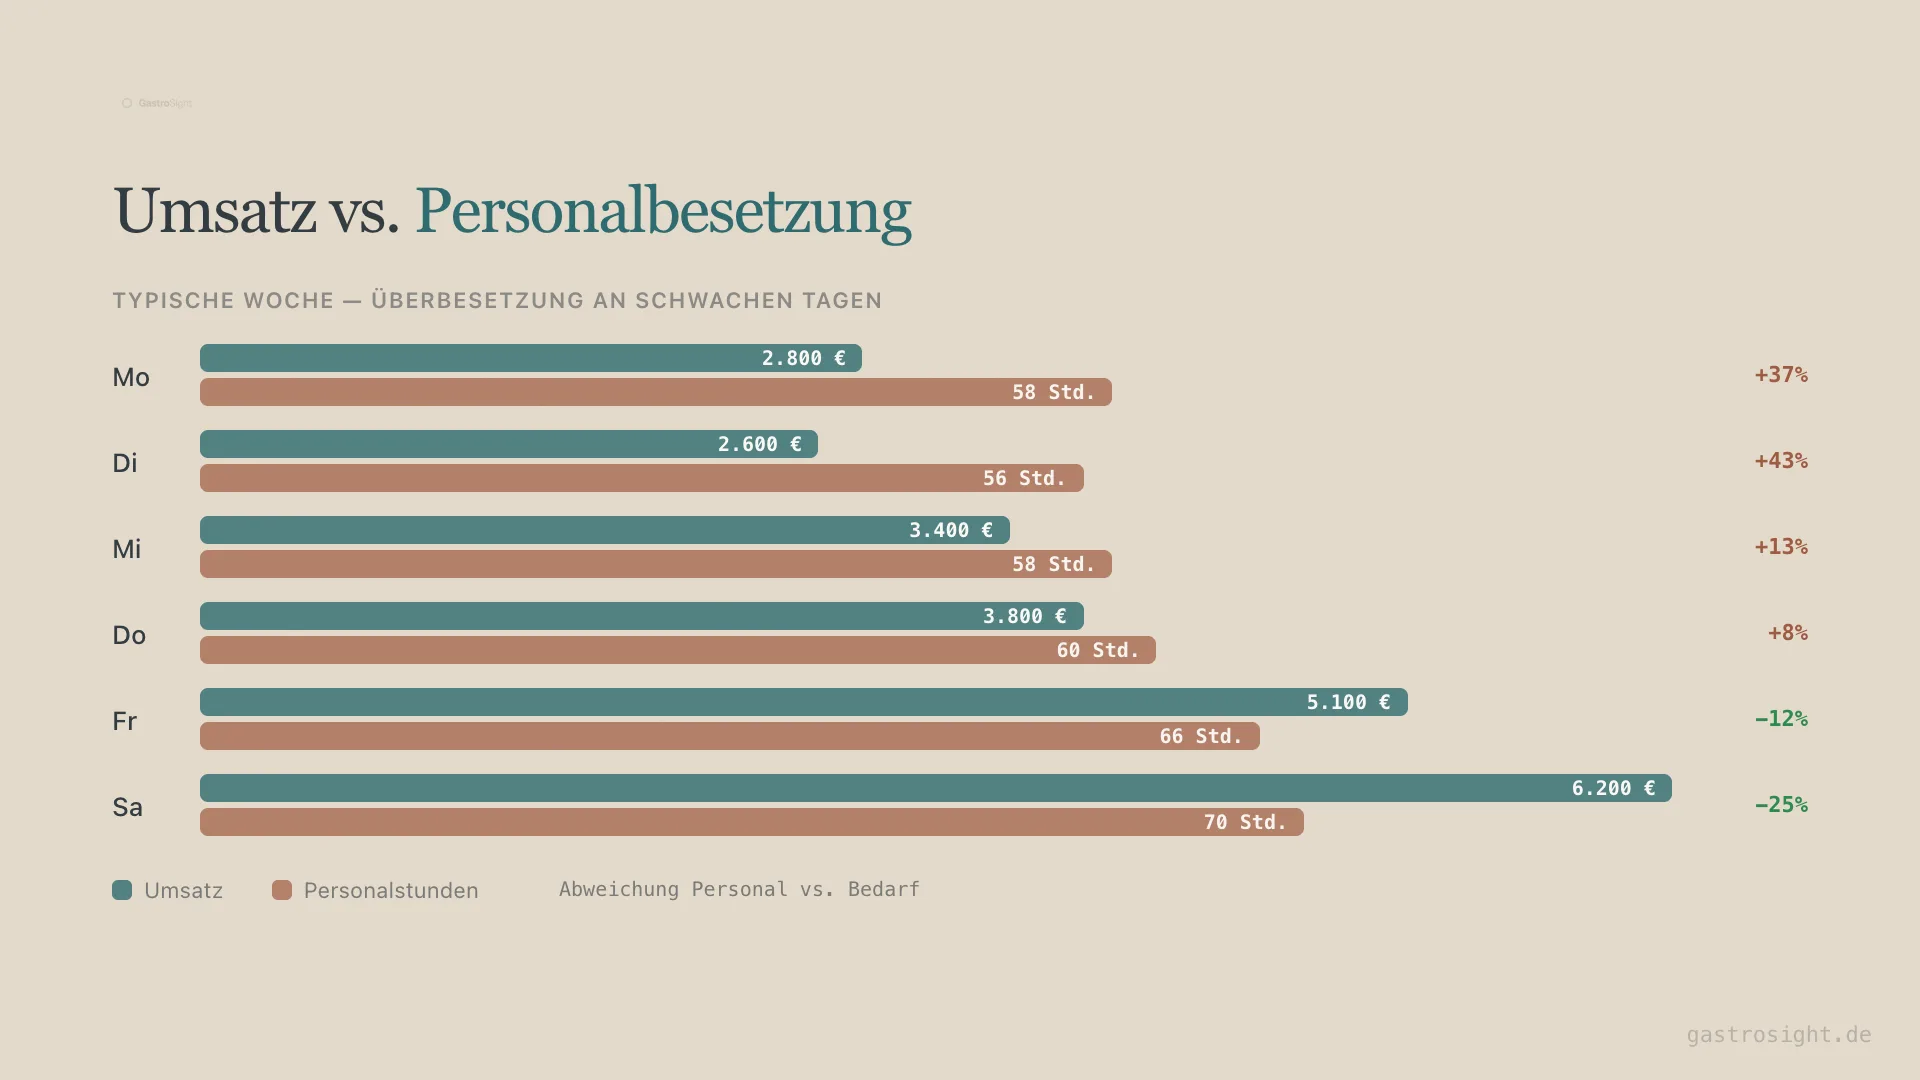
The result is a pattern I see in almost every restaurant: on busy days you are short of people. On quiet days too many are standing around. The average labor cost percentage looks fine, but the fluctuation eats the margin.
A location comparison becomes useful when sites with a similar sales profile show different labor cost percentages. That is a signal to check the rota, skill mix and service flow, not yet proof of a single cause.
Schedule by sales instead of copying
The basic idea is simple: staffing is determined not by last week but by this week's expected sales.
You need three things for that:
1. A daily sales forecast Not guessed but calculated. From historical data, weekday, season and, where possible, weather data. Accuracy depends on history and location.
2. A target for sales per labor hour The benchmark depends on the concept. Multi-unit chains with table service: €70-110 per labor hour. Fine dining: €50-80. Quick service: €90-140. If you do not know your target, divide your monthly sales by your monthly hours. That is your actual value. The target is 10-15% above it.
3. A rule for minimum staffing Certain positions have to be covered regardless of sales. The kitchen needs a base crew from opening. The bar needs at least one person. These fixed positions are not negotiable; the variable staffing on top of them is.
These three inputs give you a clear staffing frame: daily sales divided by target sales per hour gives you the available hours. Minimum staffing sets the floor. Done.
The 4 biggest shift planning mistakes
1. Even staffing across the week
The classic. The same team size from Monday to Saturday. Yet Saturday often brings in twice as much as Tuesday. If you plan evenly, you overstaff the quiet days and understaff the busy ones.
2. Shift times that do not match guest flow
Many businesses plan in rigid 8-hour shifts because it is easier. But guest flow does not follow an 8-hour rhythm. The rush lasts 2-3 hours. If you schedule a server for 8 hours, you pay 5 hours for setup and close-down, and 3 hours for actual service.
Split shifts are unpopular but effective. One person from 11am to 2pm and 6pm to 10pm covers both peaks without paying for the dead time in between.
3. No reaction to weather data
Rain on a summer evening can cost 30% of sales. Bright sunshine in a beer garden doubles them. If you fix the rota for the whole week on Monday and never touch it again, you give away the biggest optimisation potential.
The best businesses I know adjust staffing again the day before. Not to cancel staff at short notice, which destroys trust, but to activate on-call shifts or offer voluntary early finishes.
4. Not checking the plan against reality
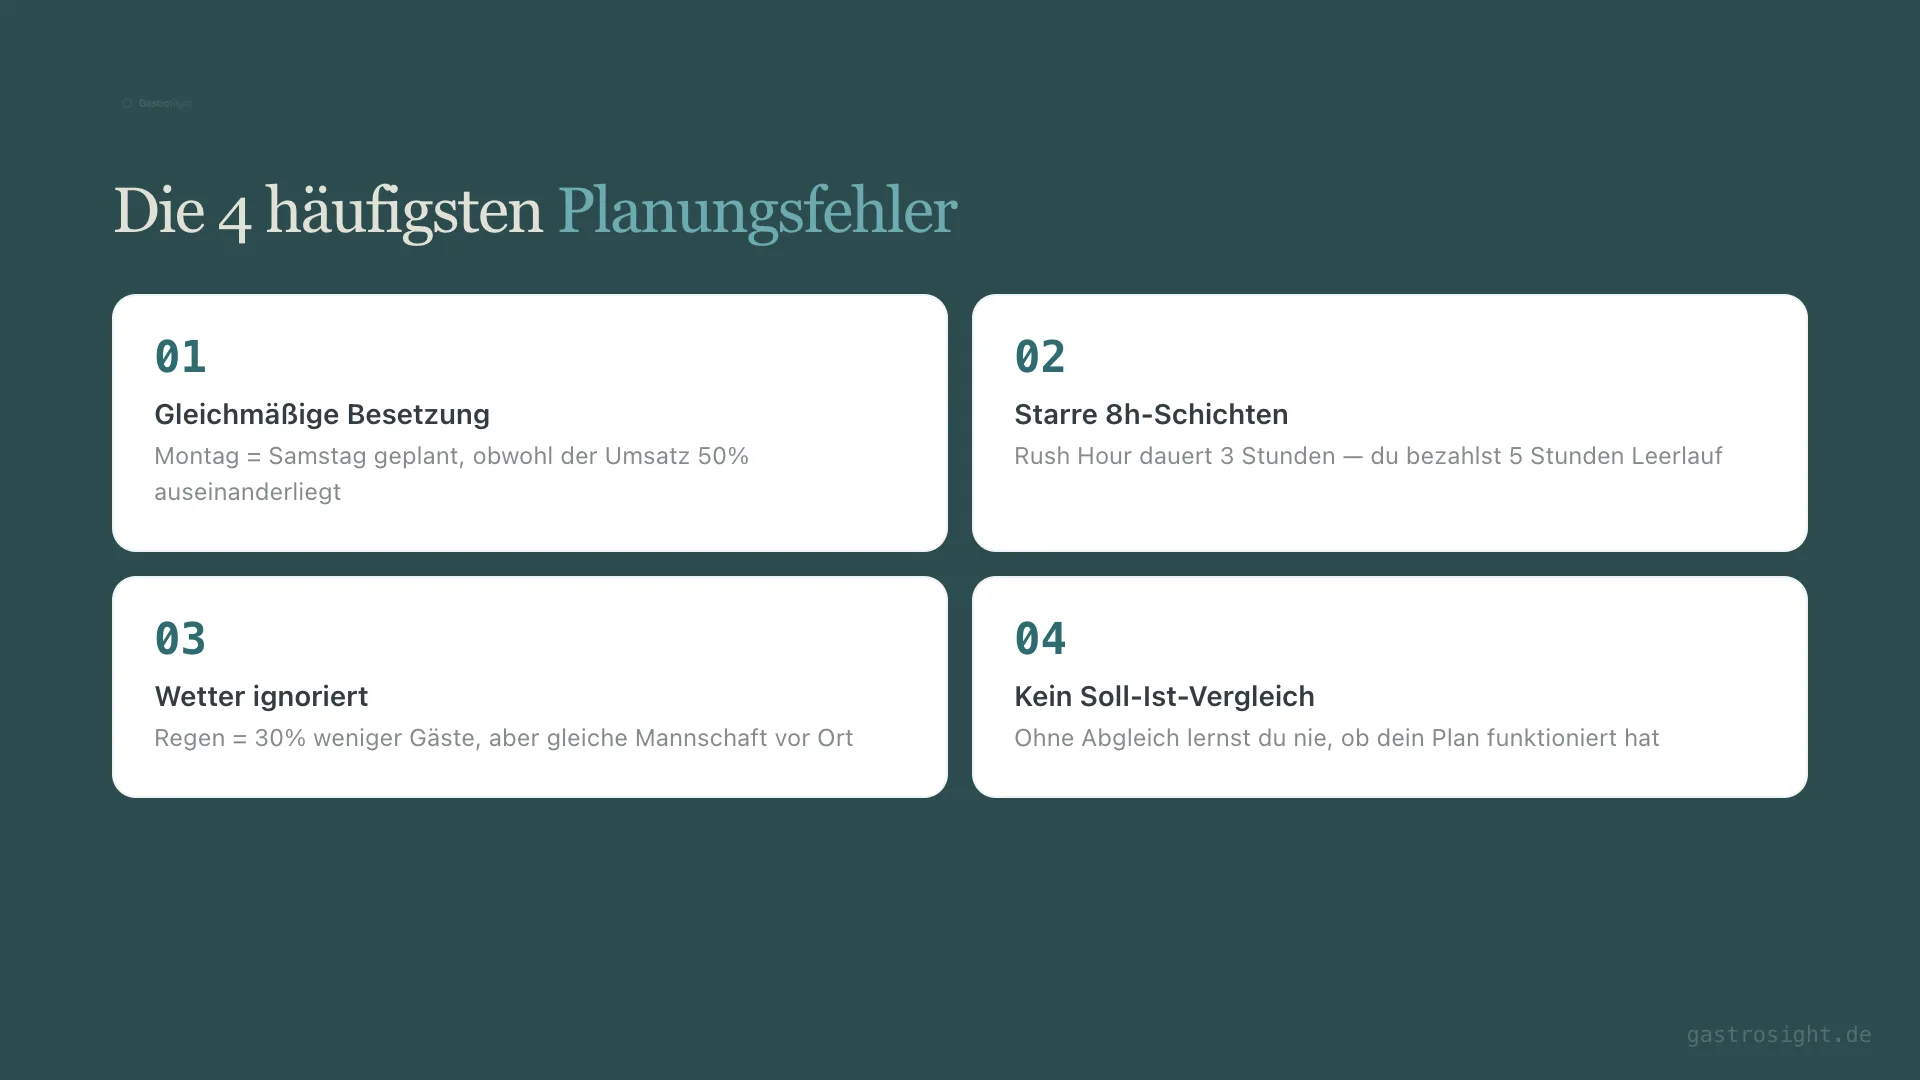
A rota without a plan-vs-actual comparison is flying blind. How many hours were scheduled? How many were actually worked? And what did sales bring in during that time?
Without that comparison you never know whether your plan worked. You plan by feel again, and the cycle starts over.
Calculating shift staffing: the formula
Calculating the right staffing per shift is not rocket science. It just needs the right inputs.
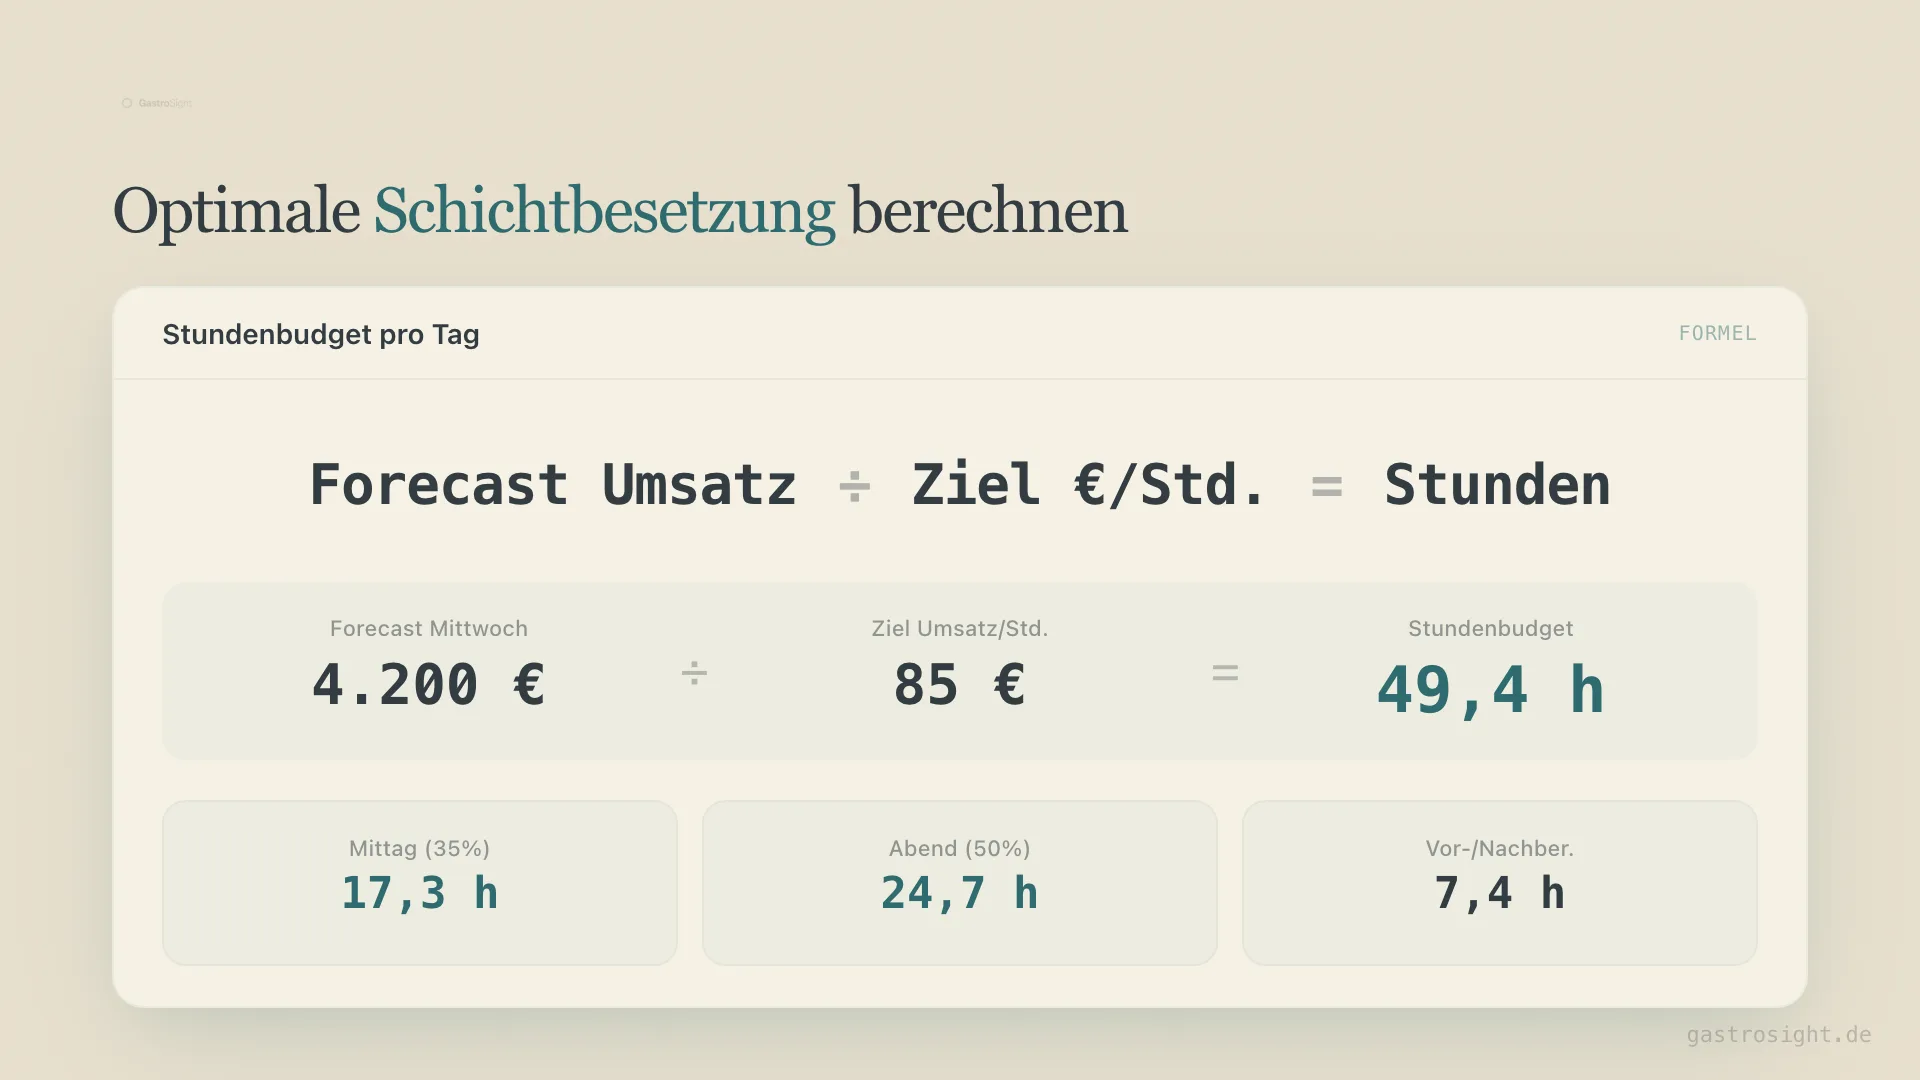
Available labor hours per day:
Daily sales (forecast) ÷ target sales per labor hour = budget in hours
Example:
- Forecast for Wednesday: €4,200
- Target: €85 per labor hour
- Budget: 49.4 hours
You distribute those 49 hours across the shifts. If the lunch peak brings in 35% of daily sales, it gets 35% of the hours. The evening peak gets the rest, minus setup and close-down.
Sounds mechanical. It is. And that is exactly what makes it better than gut feel.
Whether the method works is measured over a defined before-and-after period: the same locations, comparable sales periods, documented plan changes and the labor cost percentage actually achieved. Only then can you attribute an effect on results.
Forecast meets rota: data-driven scheduling
The sales forecast is the foundation. But it only becomes valuable when it feeds directly into staff scheduling.
In practice it looks like this:
Sunday: the forecast for the coming week is ready. It is calculated from historical sales (same weekday, same calendar week last year, trend of the last 4 weeks), holiday effects and weather data.
Monday: the general manager sees an hours budget for each day. Not as a rigid target but as a frame. They build their rota within that frame.
Daily: the plan-vs-actual comparison shows whether the actual hours match actual sales. Deviations of more than 15% trigger a flag.
Weekly: an automatic report compares planned sales with actual sales and planned hours with actual hours. The general manager sees at a glance how accurate their planning was.
The key point: responsibility stays with the general manager. They know their team, they know special situations, they make the decision. But they make it based on data instead of last week. Kiosa reads the actual hours for this from the connected scheduling system (see integrations). How the finished rota reliably reaches the team depends on the channel: what a restaurant employee scheduling app needs to do is covered in a separate article.
Staff scheduling and labor cost percentage: the direct link
In restaurants, labor cost is the biggest cost block after food cost.
According to the German Federal Statistical Office, personnel expenses in German restaurants, bars, snack bars and cafés were 32.8% of sales in 2024 (2019: 30.6%; Destatis, table 48112-0001, our own calculation from personnel expenses and sales). What matters is your own trend per location and week.
Labor cost percentage is the central KPI, and most of it is variable cost: hours that are scheduled and used.
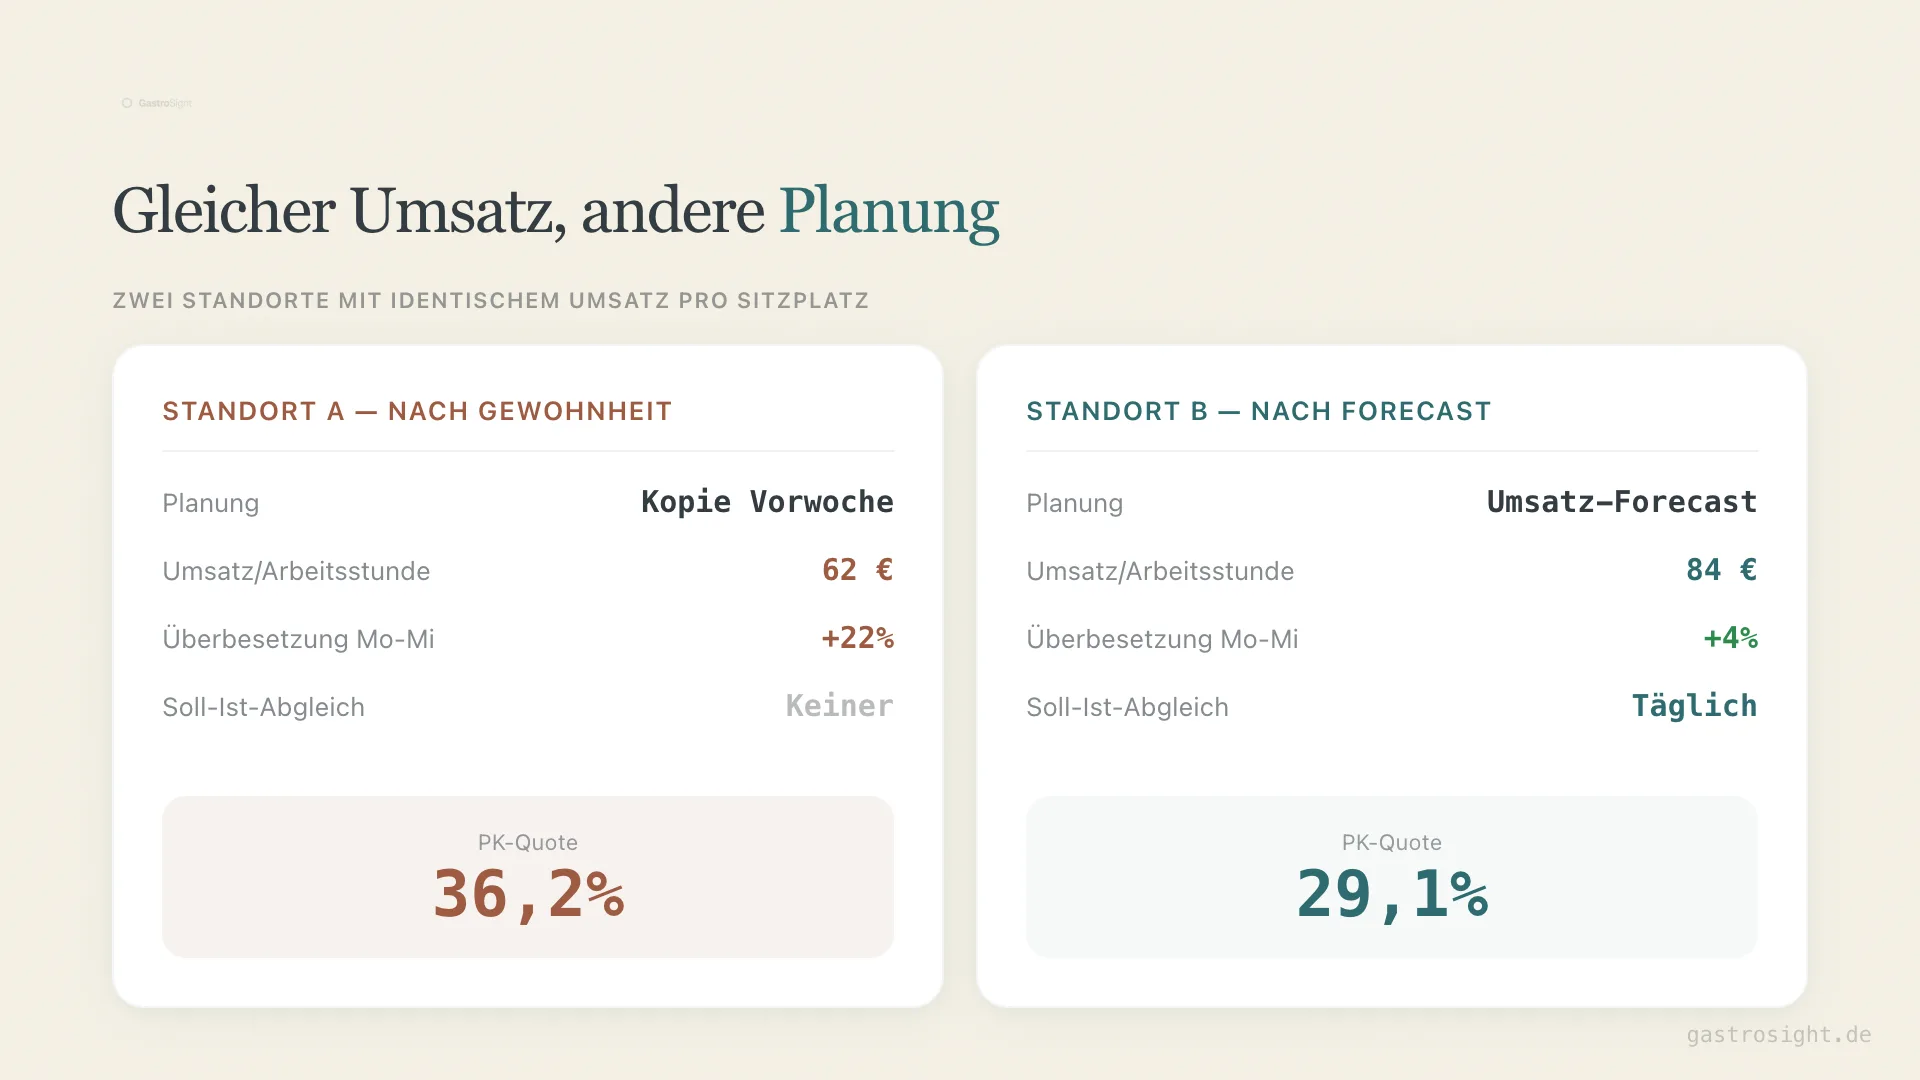
The labor cost percentage is the result of thousands of small decisions: who works on Tuesday? Do we need the fifth person on Saturday evening? Can the morning shift leave an hour early if lunch was quiet?
Each single decision moves the labor cost percentage by fractions. But over a month, a quarter, a year, those fractions add up.
The businesses I know that consistently stay below 30% labor cost percentage have three things in common:
- They schedule by forecast, not by habit. Every week is recalculated.
- They measure sales per labor hour per shift. Not just as a monthly average, but daily.
- They react to deviations within 24 hours. If Tuesday was 25% below forecast, Wednesday's plan is adjusted.
None of these businesses has a magic tool. But all of them have a system. And the system rests on a simple conviction: staff scheduling is not an admin task. It is the most important operational decision of the day.
From analysis to action
What this is about: a practical scheduling process and typical rota mistakes.
Put it into practice: Kiosa Scheduling: AI draft from the sales forecast with rule checks
More on Labor costs and scheduling
- Restaurant Labor Cost Percentage: How to Calculate and Benchmark It
- Restaurant Labor Scheduling Based on Sales: Hours Budget, RPLH and Plan vs. Actual
- Restaurant Scheduling Software: Features and Selection Criteria
FAQ
How often should the rota be adjusted?
Create it once a week, review it once a day. The base plan is ready on Sunday for the coming week. Short-term adjustments (weather, bookings) happen the day before. Not on the same day: that is unfair to the team and can be legally tricky.
What is a good benchmark for sales per labor hour?
Multi-unit chains: €70-110. Full service: €60-90. Quick service: €90-140. But the best benchmark is your own locations. Compare the best with the worst; the difference is your optimisation potential.
Should I introduce split shifts?
Yes, if it suits the business. They are unpopular but effective. Important: communicate openly, pay fairly and do not force them on everyone as the standard. Some staff prefer split shifts because they get the afternoon off. Ask your team.
How accurate does the forecast need to be?
±10% is enough for good staff scheduling. Getting better than ±10% costs a disproportionate amount of effort. Consistency matters more than accuracy: better to be ±10% off every day than spot-on three times and completely wrong twice.
What does a plan-vs-actual comparison actually deliver?
It shows you whether your planning works. If you systematically overschedule, you see it after two weeks. If a general manager consistently plans below forecast and then calls in overtime, you see that too. Without a comparison, all rotas look equally good.
Your next step
In most restaurants, staff scheduling is treated like an admin task: it has to be done, it is annoying, it gets done on the side. But it is the biggest lever you have.
Start with one thing: calculate your current sales per labor hour, per day, not per month. That number alone shows you on which days you are giving money away. Embedding it in a restaurant dashboard that connects POS, labor and your P&L is the next step.
If you run several locations and want to see how forecast, rota and labor cost percentage come together in one dashboard: book a demo and I will show you what it looks like at Mama Trattoria.
Related terms
- Schedule efficiency: ratio of scheduled to actually required labor hours
- Labor cost ratio: labor cost relative to sales
- Revenue per labor hour: productivity KPI for managing staff
- Forecasting: sales forecasting as the basis for staff scheduling
