A restaurant inventory count records the stock you actually have on hand at a fixed point in time. Most businesses need a year-end stock figure for their accounts; the exact requirement depends on your country and legal form, so clarify it with your accountant. For day-to-day control, a once-a-year count isn't enough: it pays to check high-turnover product groups such as spirits or fresh produce weekly or monthly. For that you need a traceable inventory sheet: item, storage location, unit, counted quantity and a consistently determined net unit cost. A purchase list, by contrast, only shows what came in, not what was actually used. The section on usage below shows which number from the count later goes into your food cost percentage.
Explained by an operator, checked automatically by software. I'm a restaurateur, not an accountant. This article covers the operational side of counting stock; it doesn't replace legal or tax advice. For questions about the formal requirements for your business, bring your accountant in. As of November 2026.
Free inventory sheet as an Excel template — no sign-up. The workbook also includes recipe costing and a menu item sales analysis. All example values are fictitious and can be replaced with your own. You'll find the file, with a description of its three worksheets, on the page Restaurant inventory template.
Table of contents
- Why isn't a once-a-year count enough?
- Which counting methods are there?
- How often should you check each product group?
- Preparing and running the count
- These fields belong on the inventory sheet
- Usage from opening stock, purchases and closing stock
- What does shrinkage caught early look like in practice?
- Common mistakes in counting and stock comparison
- From Excel to an inventory system
- FAQ
- Your next steps
Why isn't a once-a-year count enough?
The year-end count answers one question: does the stock on the closing date match the books? It doesn't answer when a variance arose, how it arose, or whether it's continuing. If a gap of several hundred euros shows up on 31 December, the year is over — the gap may have built up over twelve months, in small steps that would never have been noticed on their own.
That's the difference between ticking a box for the accounts and controlling your own business. The annual count is a snapshot. It shows you that something is missing — not since when, and usually not why. It isn't enough to tell you whether your storeroom, your bar or your recipe costing has a structural problem.
In-year checks still rarely happen, for a mundane reason: they take time, and without a fixed system the good intention fades in the daily rush by the second week. A practical frequency therefore only works if it's small enough to sustain — not the entire stock every week, but specifically the product groups where a variance hurts most.
Which counting methods are there?
Three approaches are common. The goal is the same in each case: at the end, the stock figure must be demonstrably correct.
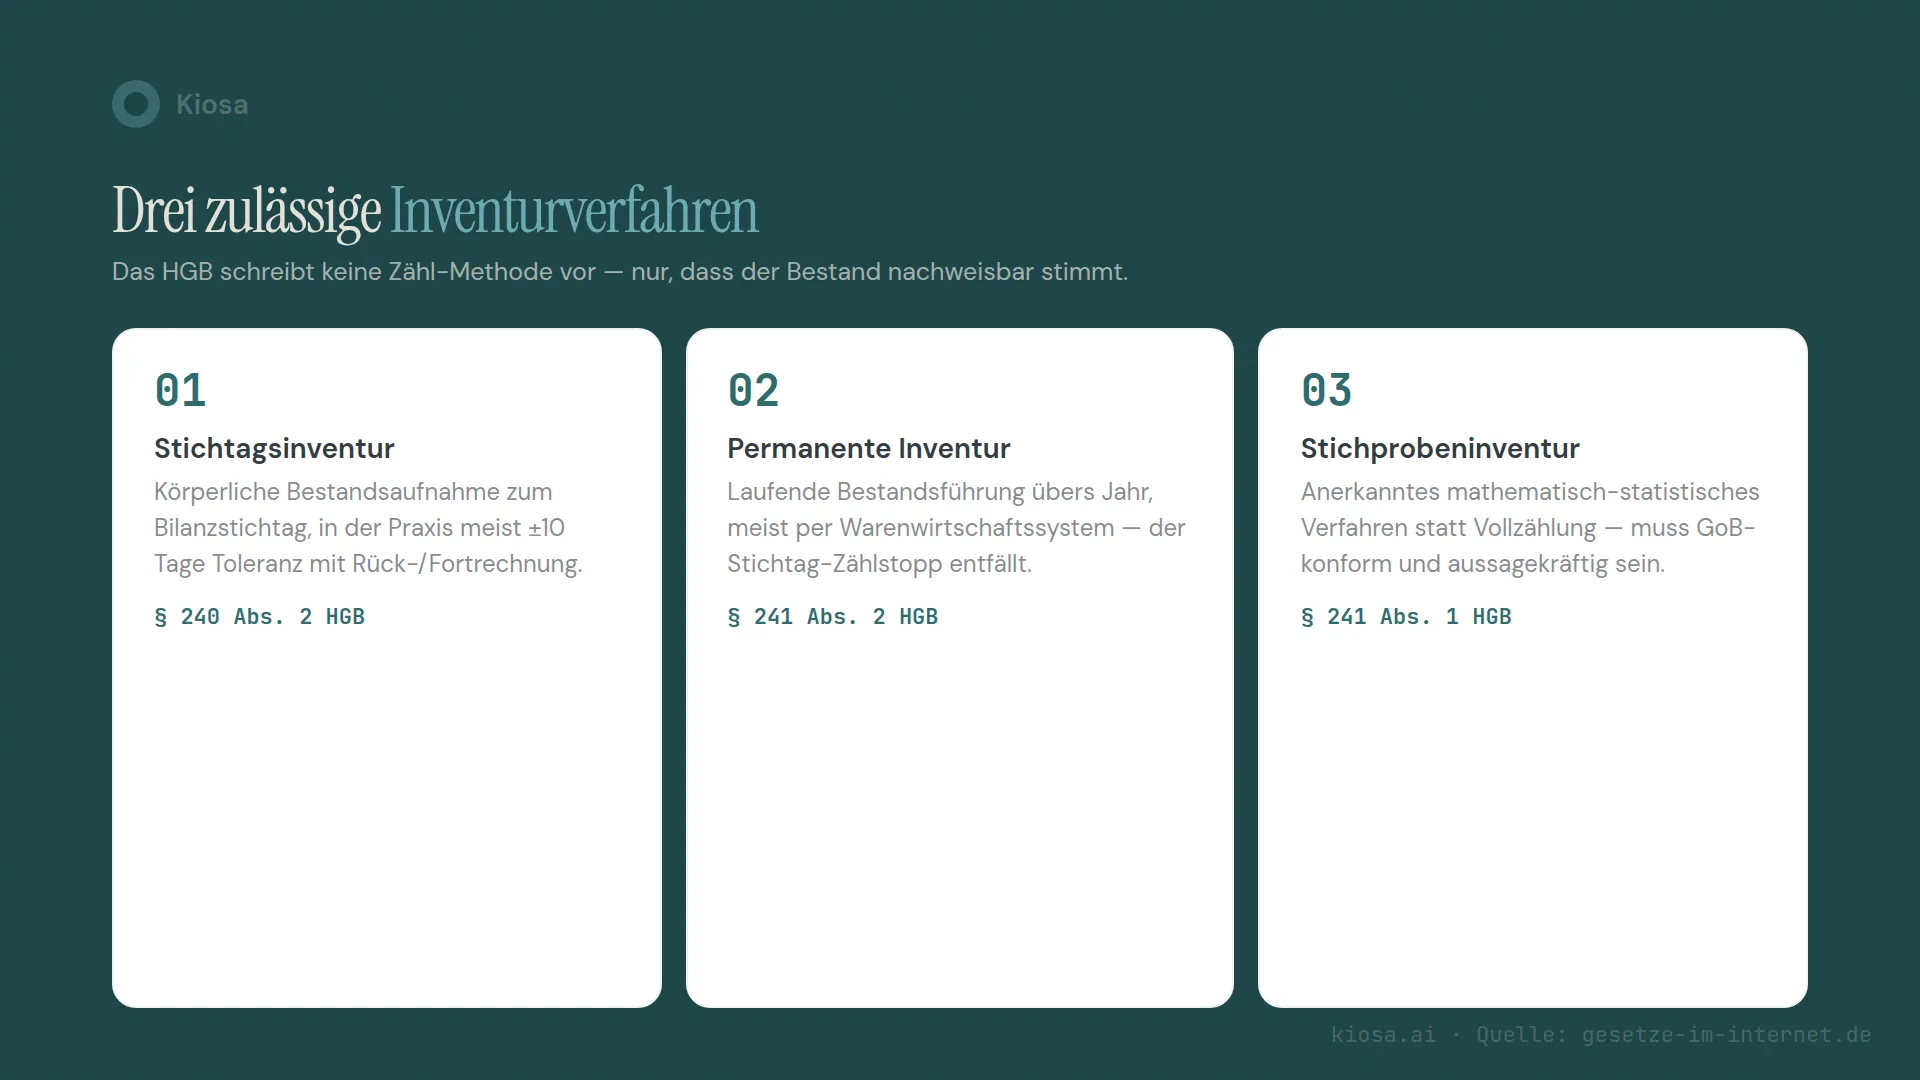
Full periodic count. The classic approach: the entire stock is physically counted on the closing date. In practice, the count is often done within a window of around ten days around the closing date, with purchases and usage rolled back or forward to that date.
Perpetual inventory. Instead of counting everything on one day, stock is maintained continuously throughout the year — every delivery and every usage is recorded, usually in an inventory management system. On the closing date the stock figure is already known without a count on that day. The precondition is that the running records are kept properly.
Sample-based count. Stock isn't counted in full but determined using a recognised statistical sampling method. That's an accepted simplification for large, homogeneous stocks, but it's rarely practical for most individual restaurants, because the range of products is too wide and the quantities too small for a statistically robust sample.
For most restaurants, the full periodic count remains the most practical choice for the year-end — combined with ongoing checks during the year, which nobody requires but which make the commercial difference.
How often should you check each product group?
Not every product group needs the same frequency. Expensive, easily removed or quickly perishable goods deserve closer control than dry goods that barely move for weeks.
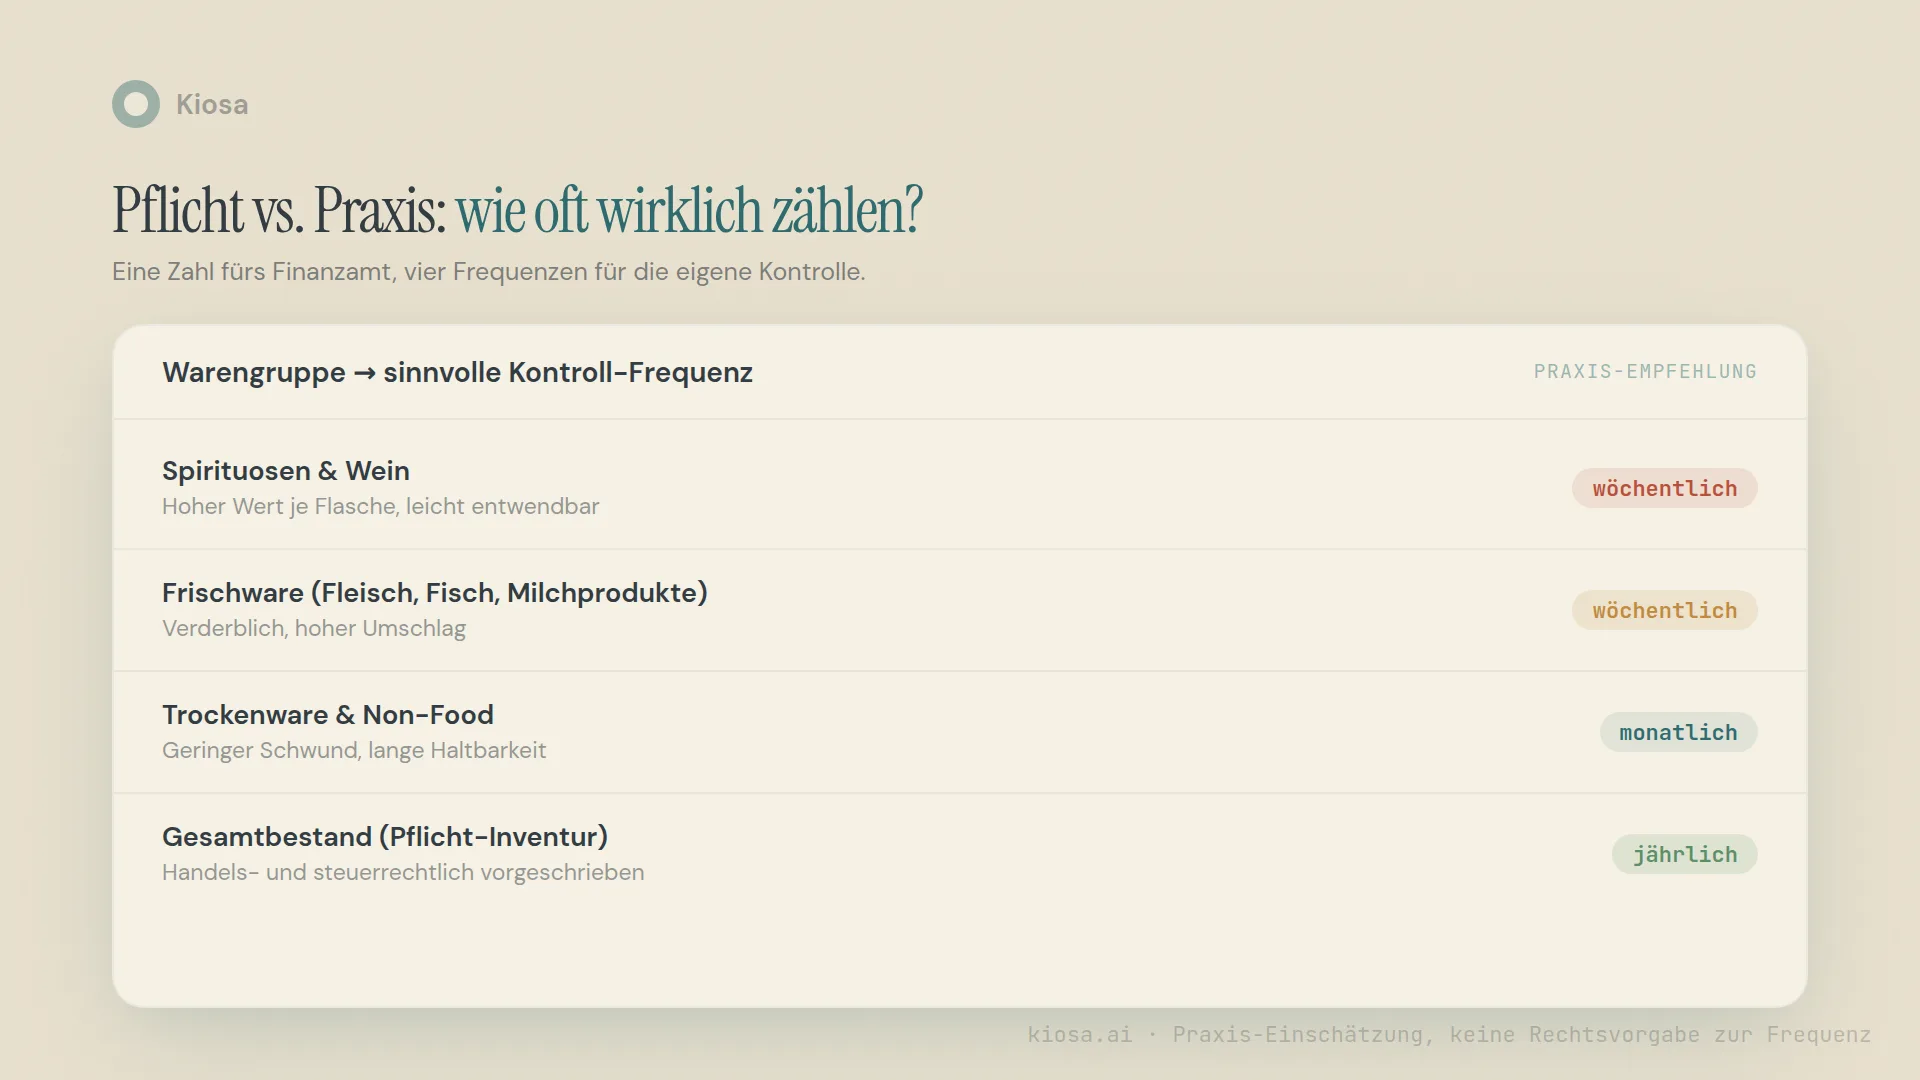
Spirits and wine — weekly. High value per bottle, easy to take, often only checked against the till instead of with a real stock count. Exactly the product group where a shortfall goes unnoticed longest if nobody counts in between.
Fresh produce (meat, fish, dairy) — weekly. High turnover, short shelf life. Here shrinkage usually shows up not through theft but through spoilage, wrong portioning or misjudged purchasing. These patterns only become visible if you regularly check against the theoretical value from your recipe costing.
Dry goods and non-food — monthly. Less shrinkage, longer shelf life, lower risk. A monthly spot check is usually enough to catch larger variances without tying up unnecessary time.
Total stock — annually, as the year-end count. The full count remains the basis for your accounts, regardless of how often you check partial stocks in between.
These frequencies are a practical assessment, not a legal requirement. In-year checks are a steering tool, not a compliance topic.
Preparing and running the count
- Fix the timing and scope. Which storage locations, product groups and restaurants are included? Sales must later be cut off for exactly the same period.
- Cut off movements. Document deliveries, returns and transfers around the time of the count so they're neither missing nor counted twice.
- Standardise units. Don't mix up kilograms, litres, bottles and cases. For opened containers, record quantities in a traceable way.
- Count and document. One person counts, a second checks conspicuous values. Items may be stored in several locations; merge them completely afterwards.
- Value and sense-check. Value quantities at the appropriate net unit cost. Check large variances first against unit, price, missing storage locations and posting date.
The template supports the operational preparation. The formal requirements and valuation methods for your accounts are something to agree with your bookkeeper; this guide doesn't prescribe a method for tax purposes.
These fields belong on the inventory sheet
| Field | Why it matters |
|---|---|
| Period and location | makes opening stock, closing stock and sales comparable |
| Item and storage location | prevents forgotten or duplicated stock |
| Unit | keeps counted quantity and price basis together |
| Counted quantity | documents the physical stock |
| Net unit cost | separates stock value from sales tax |
| Net stock value | quantity × unit cost |
| Comment on variance | keeps checks and causes traceable |
A case of six bottles isn't a single bottle. Either you calculate with case quantity and case price, or with bottle quantity and bottle price. If you mix the two, you create a calculated variance without any real loss.
Usage from opening stock, purchases and closing stock
Usage = opening stock + purchases − closing stock. This simple calculation requires a proper period cut-off and consistent valuation. Returns and transfers must be reflected correctly in the movements.
Fictitious monthly example: €12,000 opening stock plus €24,000 net purchases minus €10,000 closing stock gives €26,000 usage. With €80,000 in net sales, the food cost percentage is 32.5 percent. That's a worked example, not a recommendation for a target percentage.
For a quick calculation, use the food cost calculator. To check actual usage against quantities sold and recipe costs, read actual vs. theoretical food cost. Recipe costing and measured stock usage answer different questions.
What does shrinkage caught early look like in practice?
A worked example makes the difference tangible, using an entirely made-up model business with no connection to real numbers: according to its food cost records, the wine bar "Rotwild" should hold 340 bottles of a particular wine. At a spot count at the end of the month, there are only 322 bottles on the shelf.
Variance = (340 − 322) ÷ 340 × 100 = 5.3%
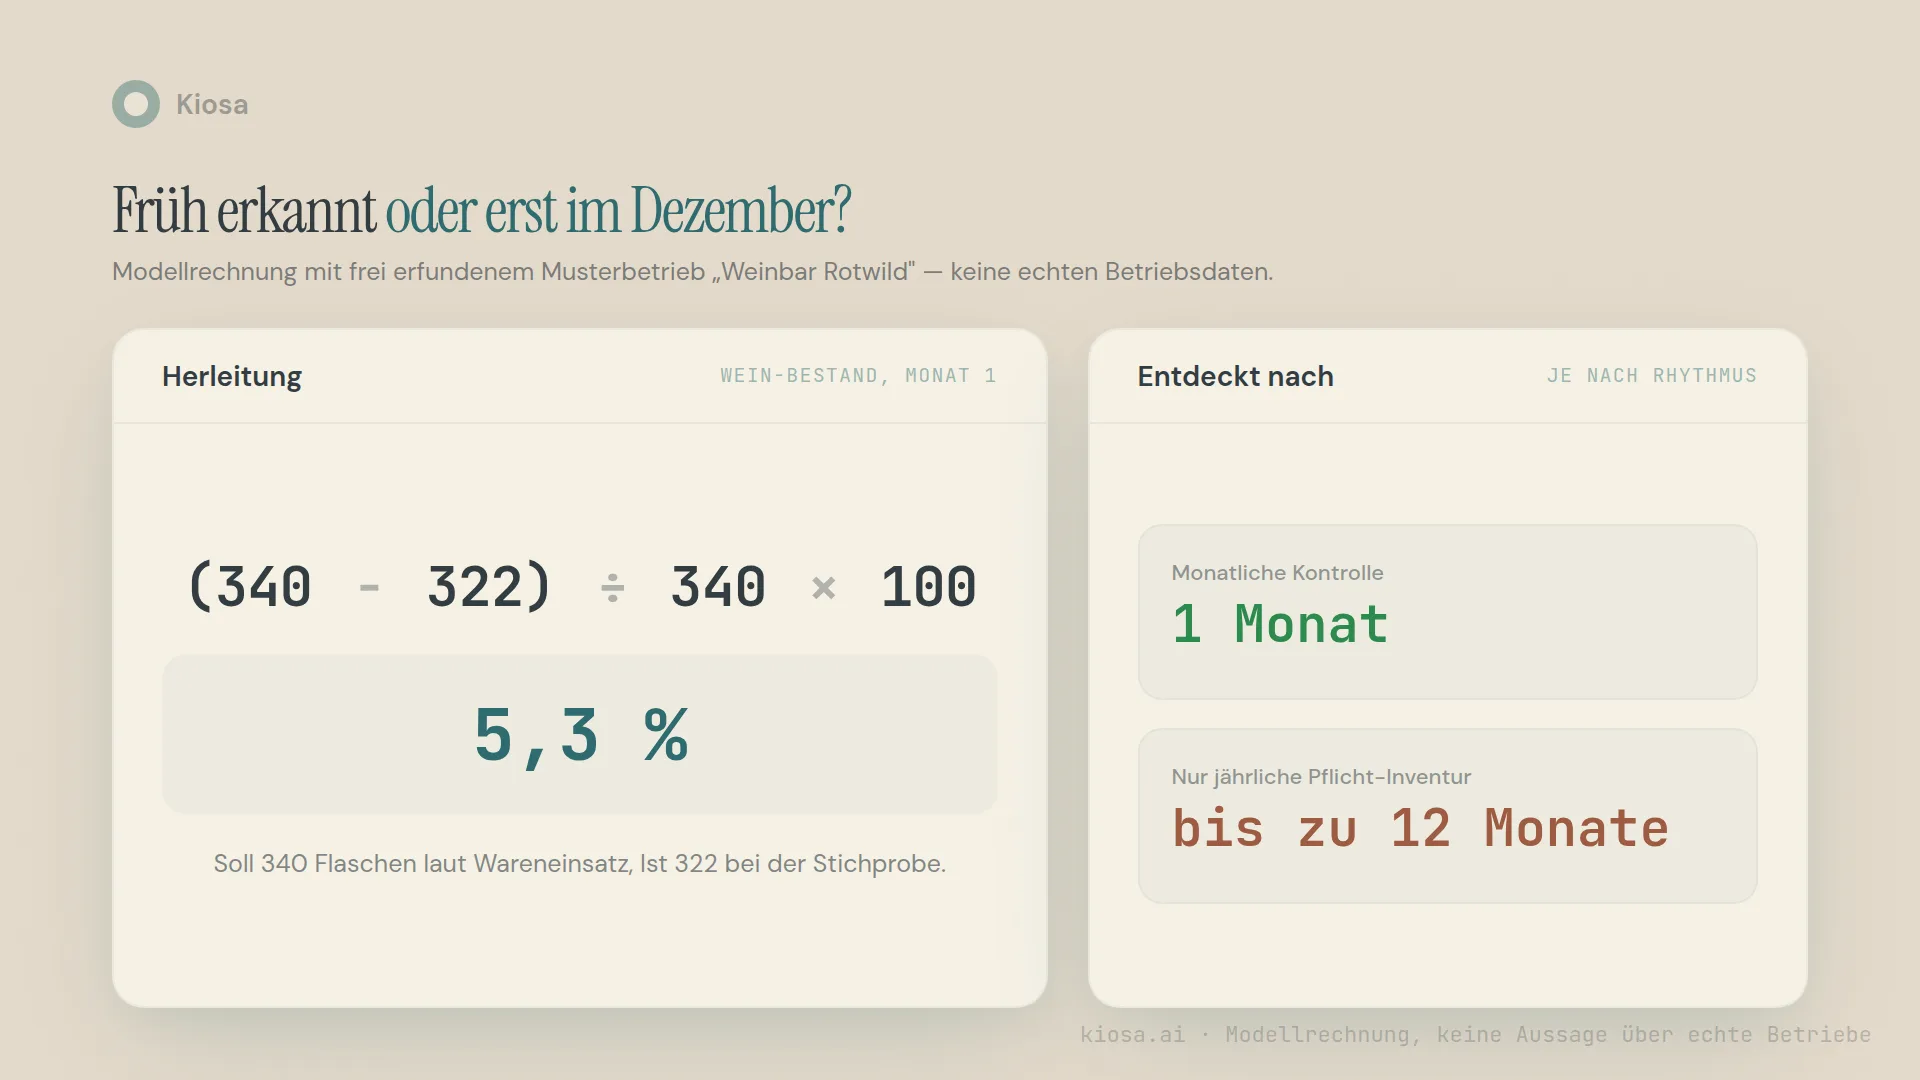
With monthly checks, this variance becomes visible after one month — enough time to check whether it's due to wrong portioning, a posting error or real shrinkage before the pattern repeats. If the business relies solely on the annual count, the same variance can go unnoticed for up to twelve months. If it repeats month after month, it adds up to a stock loss that can no longer be traced back to a single month at year-end. That's the real value of in-year checks: not the number itself, but when you see it.
Common mistakes in counting and stock comparison
The most common mistake in multi-location businesses isn't a missing year-end count — that almost always happens, if only out of fear of an audit. The mistake is that the year-end count remains the only check. Nothing happens between two closing dates, and when a variance shows up at the end, it can no longer be traced to a cause: was it a single incident in March, a creeping trend over the whole year or a wrongly costed recipe?
The second mistake: treating all product groups the same. If you check dry goods as often as spirits, you either waste time or miss things where they matter most. Frequency should follow risk: value, perishability and turnover.
Then there are the typical mistakes in stock comparison:
- Treating purchases as usage, even though stock levels have changed.
- Comparing gross prices with net sales.
- Counting a delivery once in purchasing and again in a transfer between locations.
- Estimating opened containers without documenting the unit and method.
- Using outdated unit costs and interpreting the price change as a quantity loss.
- Explaining variances as shrinkage straight away, before completeness and cut-off have been checked.
From Excel to an inventory system
Excel is a sensible starting point for a manageable, clearly scoped count. With several locations you also need shared item names, clear responsibilities and traceable changes. A file doesn't take care of that on its own.
Kiosa Inventory connects recipe costs, purchase prices and stock counts with operational controlling. At every count, the module compares the usage that should have occurred according to recipes and portions sold with the actual stock — not as a once-a-year snapshot, but as a recurring actual vs. theoretical comparison. The dashboard shows you when a count is overdue, and purchase prices from your supplier invoices flow into recipe costing. If a product group deviates more than expected and you count it weekly, you see it in the week it happens — not only when your accountant asks in January why food cost was so high.
Kiosa doesn't replace your POS. It connects to it (officially OktoPOS and Hypersoft) and brings POS data together with recipes, purchase prices and stock counts that would otherwise sit in separate places. Which data can be connected and what upkeep is needed, we check for each specific business. The menu item sales analysis then uses quantities sold and contribution margins for the menu.
From analysis to action
What this is about: how often to count per product group, the count sheet, and a traceable stock and usage calculation.
Put it into practice: Stock counts in Kiosa Inventory
More on Food cost and inventory
- Food Cost Percentage Formula: Calculation, Example, Calculator
- Restaurant Shrinkage: Where the Percentage Points Disappear
- Actual vs Theoretical Food Cost: Formula and Worked Example
FAQ
Is there a free restaurant inventory count template?
Yes. The free Kiosa Excel file contains an inventory sheet plus recipe costing and a menu item sales analysis. You can download it without signing up, edit it locally and replace the fictitious example values. It doesn't sync any POS data.
Is a restaurant inventory count legally required?
In most cases your annual accounts require a year-end stock figure, but the exact rules depend on your country and legal form. Clarify them with your accountant. For controlling shrinkage day to day, a once-a-year count on its own isn't enough.
How often should a restaurant do an inventory count?
For operational comparisons, choose a rhythm that fits your stock volume, data quality and need for control. It makes sense to check spirits, wine and fresh produce weekly, dry goods and non-food monthly, and the total stock annually as the year-end count. The formal requirements for your accounts are a separate matter to agree with your bookkeeper.
Is the purchase total enough for the food cost percentage?
No. For actual usage you have to account for the change in stock: opening stock plus purchases minus closing stock. Purchases divided by sales gives you a purchasing ratio, not food cost.
What's the difference between a full periodic count and perpetual inventory?
With a full periodic count, the entire stock is physically counted on a fixed date. With perpetual inventory, stock is updated continuously in an inventory management system, so no separate count is needed on the closing date — the stock figure is already known, provided the running records are kept properly.
How do I compare inventory counts across several restaurants?
Use the same count date or cleanly cut-off periods, shared units and consistent valuation. Transfers must be traceable on both sides. Then compare matching item groups and concepts rather than just totals.
Your next steps
- Decide which product groups carry the highest risk for you (usually spirits and fresh produce) and schedule a fixed weekly or monthly spot check for them, independent of the year-end count.
- At your next check, compare the theoretical value from your recipe costing with the actual stock, not just with the last count. Only the actual vs. theoretical comparison shows whether a variance is new or has been there for a while.
- Clarify with your accountant which counting method suits your business and what your year-end requirements are.
With the P&L analyzer you can see in a few minutes how your cost structure compares with the industry.
Related terms
- Food cost ratio — food cost relative to sales, the basis of every actual vs. theoretical comparison
- COGS (cost of goods sold) — the cost of goods as the basis for stock valuation
