Restaurant shrinkage is stock that was bought but never sold — without anyone deliberately writing it off. It comes from six places: theft, spoilage, over-portioning, breakage, unrecorded items and booking errors. There is no fixed percentage that an auditor will accept without evidence. What matters is that you can explain your variance with stock count data — and for that, you first need to calculate food cost correctly from stock and purchases.
Contents
- What exactly is restaurant shrinkage?
- How high is shrinkage typically — and when does it become a problem?
- Where shrinkage actually happens: six sources
- Shrinkage or theoretical-vs-actual variance — what's the difference?
- Worked example: what 3 per cent shrinkage would cost a model business
- How to uncover shrinkage before the monthly P&L shows it
- Your next steps
- FAQ
What exactly is restaurant shrinkage?
Shrinkage is the difference between the stock that, according to purchases and recipes, should have been used and the stock that is actually missing — with no sale, documented write-off or deliberate withdrawal behind it. Put differently: it's the part of your food cost that has simply gone.
That's what separates shrinkage from normal usage. If a chef puts 200 instead of 180 grams of mozzarella on a pizza, that's over-portioning — it counts as shrinkage, because it appears in no booking. If a server gives a regular a dessert on the house and correctly records it as a comp, that isn't shrinkage. It's a documented loss you can manage. The decisive difference isn't the size of the loss, but whether it's visible.
For auditors, this is exactly the starting point: a food cost that is above the usual level for no recognisable reason becomes a costing discrepancy — and you need to be able to explain it before someone else interprets it for you.
How high is shrinkage typically — and when does it become a problem?
Guides often quote a supposed rule of thumb of about 3 per cent of food cost. We haven't found a primary source for it. BarBrain, on the contrary, writes that there is no universally valid shrinkage rate and that you shouldn't assume a fixed rate will be accepted without evidence: it depends on the type of business, the product range and your processes (BarBrain, Schwund und Bruch, retrieved 2026-11-10).
What that means in practice: there is no safe tolerance threshold. If your food cost stands out, you should be able to explain why — with stock count data, not with a guess. The problem is rarely the level alone. The problem is that most businesses only notice they're over at the next stock count, weeks or months after the loss occurred.
The most common mistake in multi-location businesses: shrinkage is treated as an annual figure, not as an ongoing process. A stock count in December shows the sum of twelve months of errors. It doesn't show whether the loss happened in March, when a new employee started, or in August, when a supplier changed its price and nobody updated the recipe costs.
Where shrinkage actually happens: six sources
Six causes explain almost every relevant case in practice. It's almost never just one — usually two or three overlap.
Theft. Stock that leaves the premises without being sold or documented — through staff or guests. The most uncomfortable point, so it's often the first thing suspected, yet rarely the first thing checked. That's the wrong reflex: theft should be the last explanation, not the first, because a premature suspicion damages team trust without hitting the cause.
Spoilage. Stock that passes its use-by date or loses quality before it's sold. Most common cause: too much stock with a short shelf life, often because order quantities are geared to sales peaks rather than the actual average. FIFO discipline and more frequent, smaller deliveries are the direct lever against it.
Over-portioning. The hardest to pin down, because nobody portions wrongly on purpose. Without scales at the pass and without a regular theoretical-vs-actual check, actual portion sizes slowly drift away from the recipe card — almost always upwards, rarely downwards.
Breakage. Broken crockery, dropped plates, product spilled in transit. Usually the smallest item in euros, but the only one that can be documented almost completely — if you don't record breakage, you give away the easiest source of shrinkage there is to clear up.
Unrecorded items. Free drinks without a booking, staff meals without a record, a coffee "on the house" that never reaches the system. Unlike a deliberately recorded comp, this stays completely invisible — it looks like shrinkage because it leaves just as few traces, but it's really a process problem at the till.
Booking errors. A new dish accidentally assigned to the wrong category. A supplier invoice booked two weeks late that lands in the wrong period. Technically not waste — but it distorts every shrinkage analysis until someone corrects the assignment, and makes real shrinkage look bigger or smaller than it is.

Shrinkage or theoretical-vs-actual variance — what's the difference?
The two terms are often used interchangeably, but they aren't the same. Shrinkage is a phenomenon: stock disappears, from one of the six sources above. The actual vs. theoretical food cost comparison is a method: it sets the theoretical food cost according to recipes against the actual food cost according to purchases and stock, and makes the difference visible.
So shrinkage is one cause of a theoretical-vs-actual variance — but not the only one. Outdated recipe costs, wrong POS mapping and over-portioning also create a variance without any real stock disappearing. That's what our detailed article on actual vs. theoretical food cost is about: how to calculate the total variance and cleanly separate its causes. This article stays with the question before that: what is shrinkage, how big is it typically, and in which six places does it arise? The method for measuring it comes afterwards.
Worked example: what 3 per cent shrinkage would cost a model business
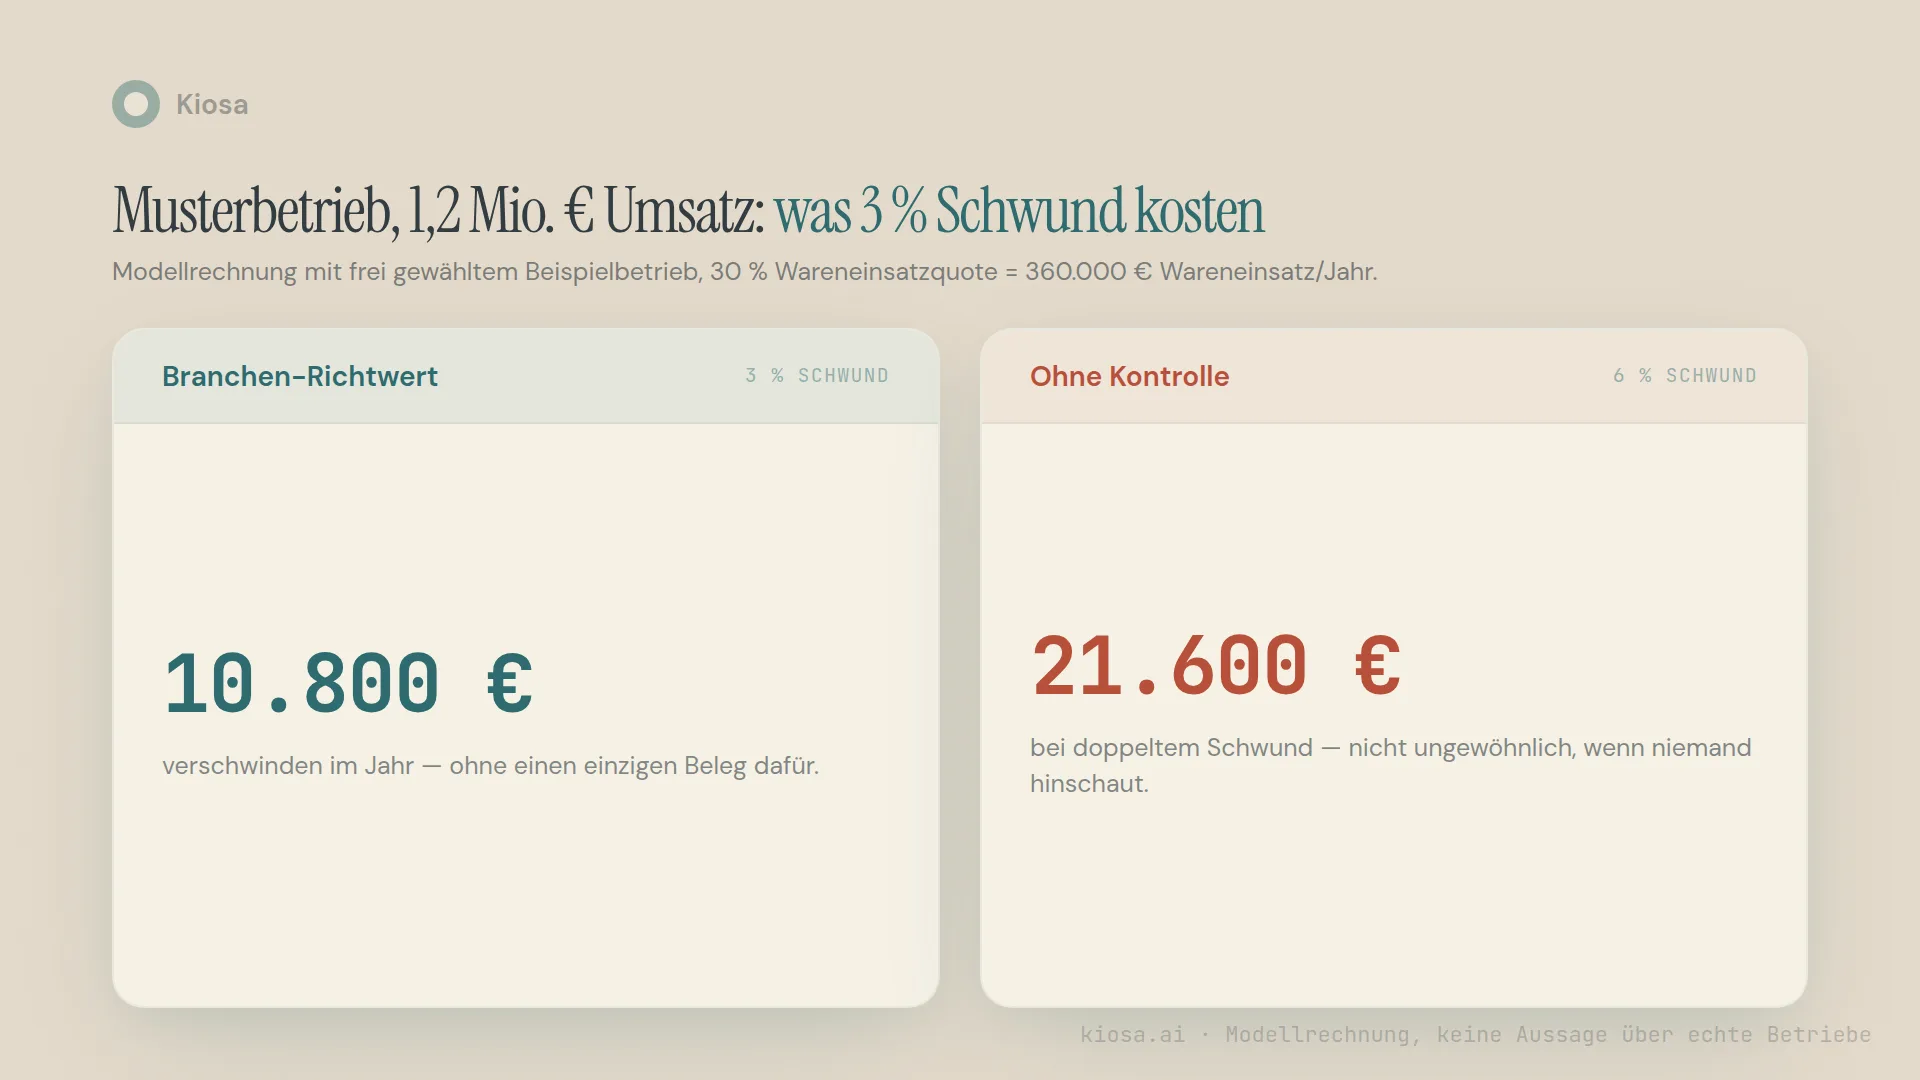
Take a model business with €1.2 million annual sales and a food cost percentage of 30 per cent — that's €360,000 food cost a year. With an assumed 3 per cent shrinkage on that sum, €10,800 disappears every year without a single document to show for it. At an assumed 6 per cent, it's €21,600.
This is a model calculation with a freely chosen example business, not a statement about a real location. But it shows the order of magnitude: shrinkage isn't a rounding error in your costing, but an amount that, with two or three locations, quickly reaches a level that decides a new hire or an investment.
How to uncover shrinkage before the monthly P&L shows it
The reason shrinkage so often shows up late: the classic chain of delivery note → bookkeeping → monthly P&L takes weeks. The delivery note arrives, gets collected, is sent to the accountant at month end, gets processed — and the P&L often only lands on your desk four to six weeks after month end. By then, the day something disappeared is long forgotten. Nobody remembers who was on shift on a particular Tuesday last month.
The theoretical-vs-actual comparison in the Kiosa Inventory module targets exactly this delay, measured directly against your food cost ratio. At every stock count, Kiosa sets the usage that should have occurred according to recipes and recorded sales against the actual stock, per location — not only when the P&L arrives six weeks later. If you count critical product groups weekly, you see a variance in the week it occurs. That shifts the question from "Why is food cost so high this month?" to "Why did the variance jump this week, and what happened?". The second question can be answered. The first usually can't any more.
Automatic anomaly detection builds on the same principle: instead of checking every number manually, the system flags deviations outside the usual pattern — for food cost, sales or void rate alike. For shrinkage, that means you see the product group with the largest variance, not just a total for the whole location. Looking at meat, fresh produce, beverages and dry goods separately makes it immediately clear whether the problem is in the kitchen or at the bar. Those are two different conversations with two different teams.
Important for perspective: whether a variance turns out to be theft, spoilage or a booking error is still decided by a person looking at the details — the software delivers the signal early enough for that review to still make a difference.
Your next steps
This week: Pull your last stock count and calculate shrinkage for a single product group (spirits or fresh meat, for example) against the food cost according to recipes. If the variance for that group is clearly higher than for the others, you have your first concrete starting point, not just a gut feeling.
Food cost calculator — Calculate your current food cost percentage in a few minutes and compare it with your own trend and your recipe costs.
Actual vs. theoretical food cost: where your money disappears — How to separate shrinkage from the other causes of a variance and calculate the total difference systematically.
30 minutes well spent. Want to see what the theoretical-vs-actual comparison looks like for your locations — with your suppliers and your recipes instead of a demo slide? Book a demo call and I'll show you with real numbers.
From analysis to action
What this is about: identifying sources of shrinkage and proving variances with stock count data.
Put it into practice: Actual vs. theoretical comparison in Kiosa Inventory
More on Food cost and inventory
- Food Cost Percentage Formula: Calculation, Example, Calculator
- Actual vs Theoretical Food Cost: Formula and Worked Example
- Restaurant Inventory Count: How Often, What to Count + Free Template
FAQ
What counts as shrinkage in a restaurant?
Stock that was bought but never sold or documented: theft, spoilage, over-portioning, breakage, unrecorded items and booking errors. A correctly recorded comp or a documented write-off doesn't count — that's a controlled loss, not shrinkage.
How high is normal restaurant shrinkage?
There is no universally valid figure. The often-quoted rule of thumb of about 3 per cent can't be traced to a primary source, and there is no rate that auditors accept without evidence (BarBrain, retrieved 2026-11-10). For your specific case, what counts is your stock count data and your accountant's assessment.
What is the difference between shrinkage and theoretical-vs-actual variance?
Shrinkage is a phenomenon: stock that has disappeared. Theoretical-vs-actual variance is the result of a method that sets recipe costs against actual food cost. Shrinkage is one possible cause of a variance, but not the only one — outdated recipes and wrong POS mapping also create a variance without any stock disappearing.
How do I know whether my shrinkage is too high?
Compare your shrinkage per product group with your own trend and with the other groups — split by meat, fresh produce, beverages and dry goods, because a single total hides the cause. If one group is consistently and clearly higher, and that stays stable over several weeks, that's the point where a targeted review pays off.
Do I need to be able to justify shrinkage to the tax authorities?
As soon as a tax audit is due, you should be able to explain why your food cost stands out — there is no flat rate that's accepted across the board; documentation is what counts. This isn't legal or tax advice. For a binding assessment in your case, ask your accountant or tax adviser; Kiosa gives you the numbers and history automatically, so you and your adviser have something to work with.
