To calculate food cost: opening stock plus purchases in the period minus closing stock. The result in euros shows what your business actually used in stock, not what you bought. The food cost percentage sets that amount against sales. You need both numbers together – one alone won't tell you whether your purchasing or your costing is the real problem.
Contents
- What is food cost?
- How do you calculate food cost?
- Food cost or food cost percentage: what's the difference?
- How does it work out for a model business?
- Which mistakes distort food cost most often?
- How do you monitor food cost continuously instead of once a year?
- FAQ
- Your next steps
What is food cost?
Food cost is the value of all food and beverages your business actually used in a given period, measured in euros, not in crates or kilograms. That's an important difference from purchases: purchases only show what you ordered and paid for. Food cost shows what actually went through the kitchen and over the bar.
Why aren't purchases enough on their own? Because in December you might stock up on two months' worth of spirits but only sell one month's worth. Your purchase total would make December look artificially expensive and January artificially cheap, even though actual usage was similar in both months. Food cost corrects this, because it includes stock at the start and end of the period.
What you call it matters less than what you do with the number: it is the basis for the food cost ratio – and therefore for almost every steering decision that has to do with purchasing, costing or portion sizes.
How do you calculate food cost?
The formula has been the same for decades, and it is deliberately simple:
Food cost = opening stock + purchases in the period − closing stock
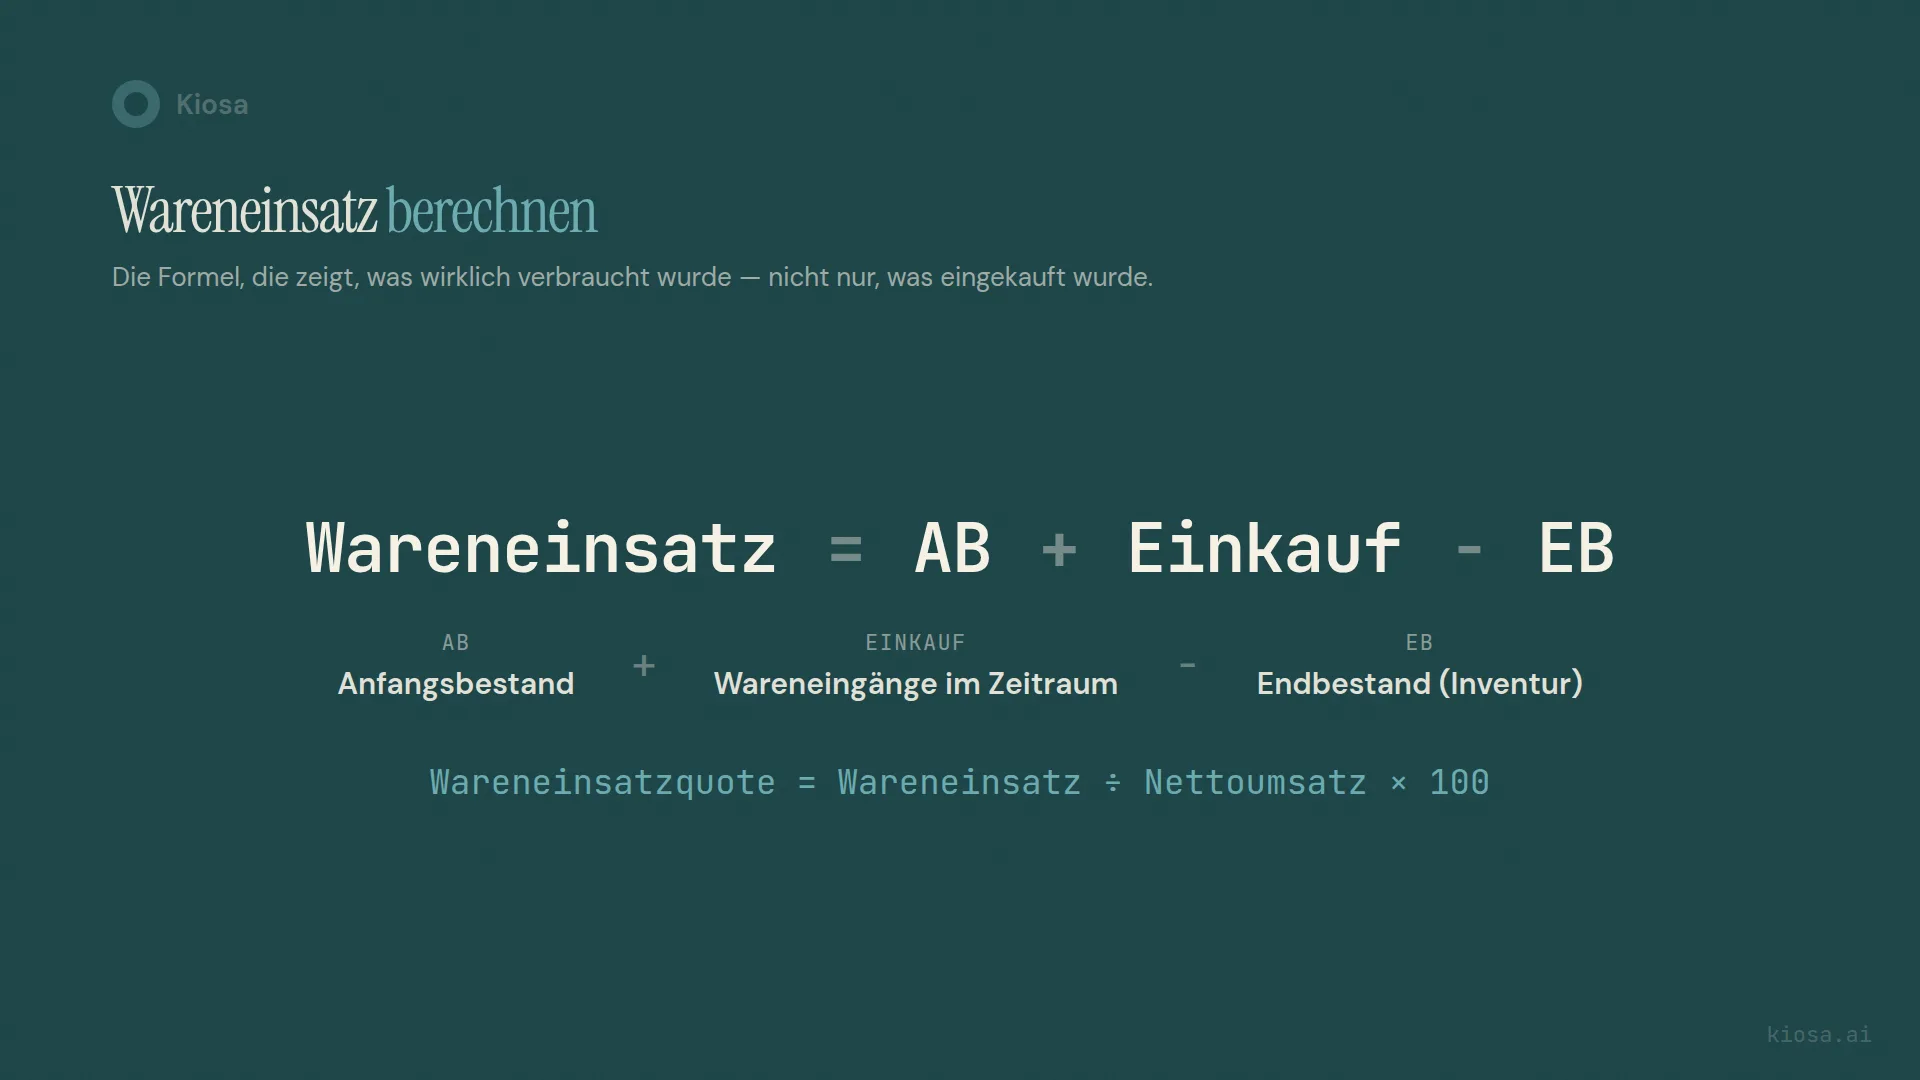
Three numbers, three sources.
Opening stock. The value of your stock at the start of the period, from the last stock count or rolled forward from the books. A monthly, quarterly or annual value, depending on the period you're calculating.
Purchases. All goods received in the period, at purchase prices. These are your supplier invoices, net, for the period between the two stock count dates.
Closing stock. The value of your stock at the end of the period. The least certain of the three numbers, because it comes from a count. And counts are only as good as the person counting and the system valuing it.
The logic behind it: what you had at the start, plus what came in, minus what's left at the end, must have been used. Not sold, not disposed of and shown separately – simply gone. The formula doesn't distinguish between sales, shrinkage and staff meals. That makes it easy to calculate and, at the same time, incomplete as the only steering metric; we'll come to that in the section on typical mistakes.
In practice, a monthly calculation with a full stock count is usually enough. If you count more often, you get more precise numbers, but also more work. The alternative I'll come to later: project food cost continuously from POS data instead of recounting every cycle.
Food cost or food cost percentage: what's the difference?
Food cost is a euro amount. Food cost percentage is a percentage. They still get confused all the time, because they often come up in the same sentence.
Food cost percentage = food cost ÷ net sales × 100
The difference is more than semantics. Two locations with an identical food cost percentage can be in completely different economic positions if their sales differ in size. A location with €800,000 annual sales and a 30 per cent food cost percentage has food cost of €240,000. A second location with €1.6 million sales and the same 30 per cent comes to €480,000. Same percentage, double the amount, double the risk with every deviation.
Conversely: one percentage point more or less automatically means more money at higher sales. That's why it isn't enough to look only at the percentage when you decide where an improvement pays off most. The percentage shows you efficiency. The euro amount shows you what that efficiency is worth.
For context on which food cost percentage counts as healthy for which concept type (meat dishes sit differently from pizza, beverages differently from desserts), see the breakdown in the food cost ratio glossary entry. There is no single flat target for "restaurants" – the industry is too varied for that.
How does it work out for a model business?
Let's work it through for a fictional business; call it "Ristorante Due Stagioni". No real numbers, no statement about a real business, just a model calculation to make the formula tangible.
Due Stagioni does €1,200,000 net sales a year. Stock starts on 1 January at €42,000. Over the year, the business buys €368,000 of goods – meat, fish, vegetables, drinks, dry goods, everything together. On 31 December, the stock count shows closing stock of €50,000, so stock is slightly higher than at the start of the year.
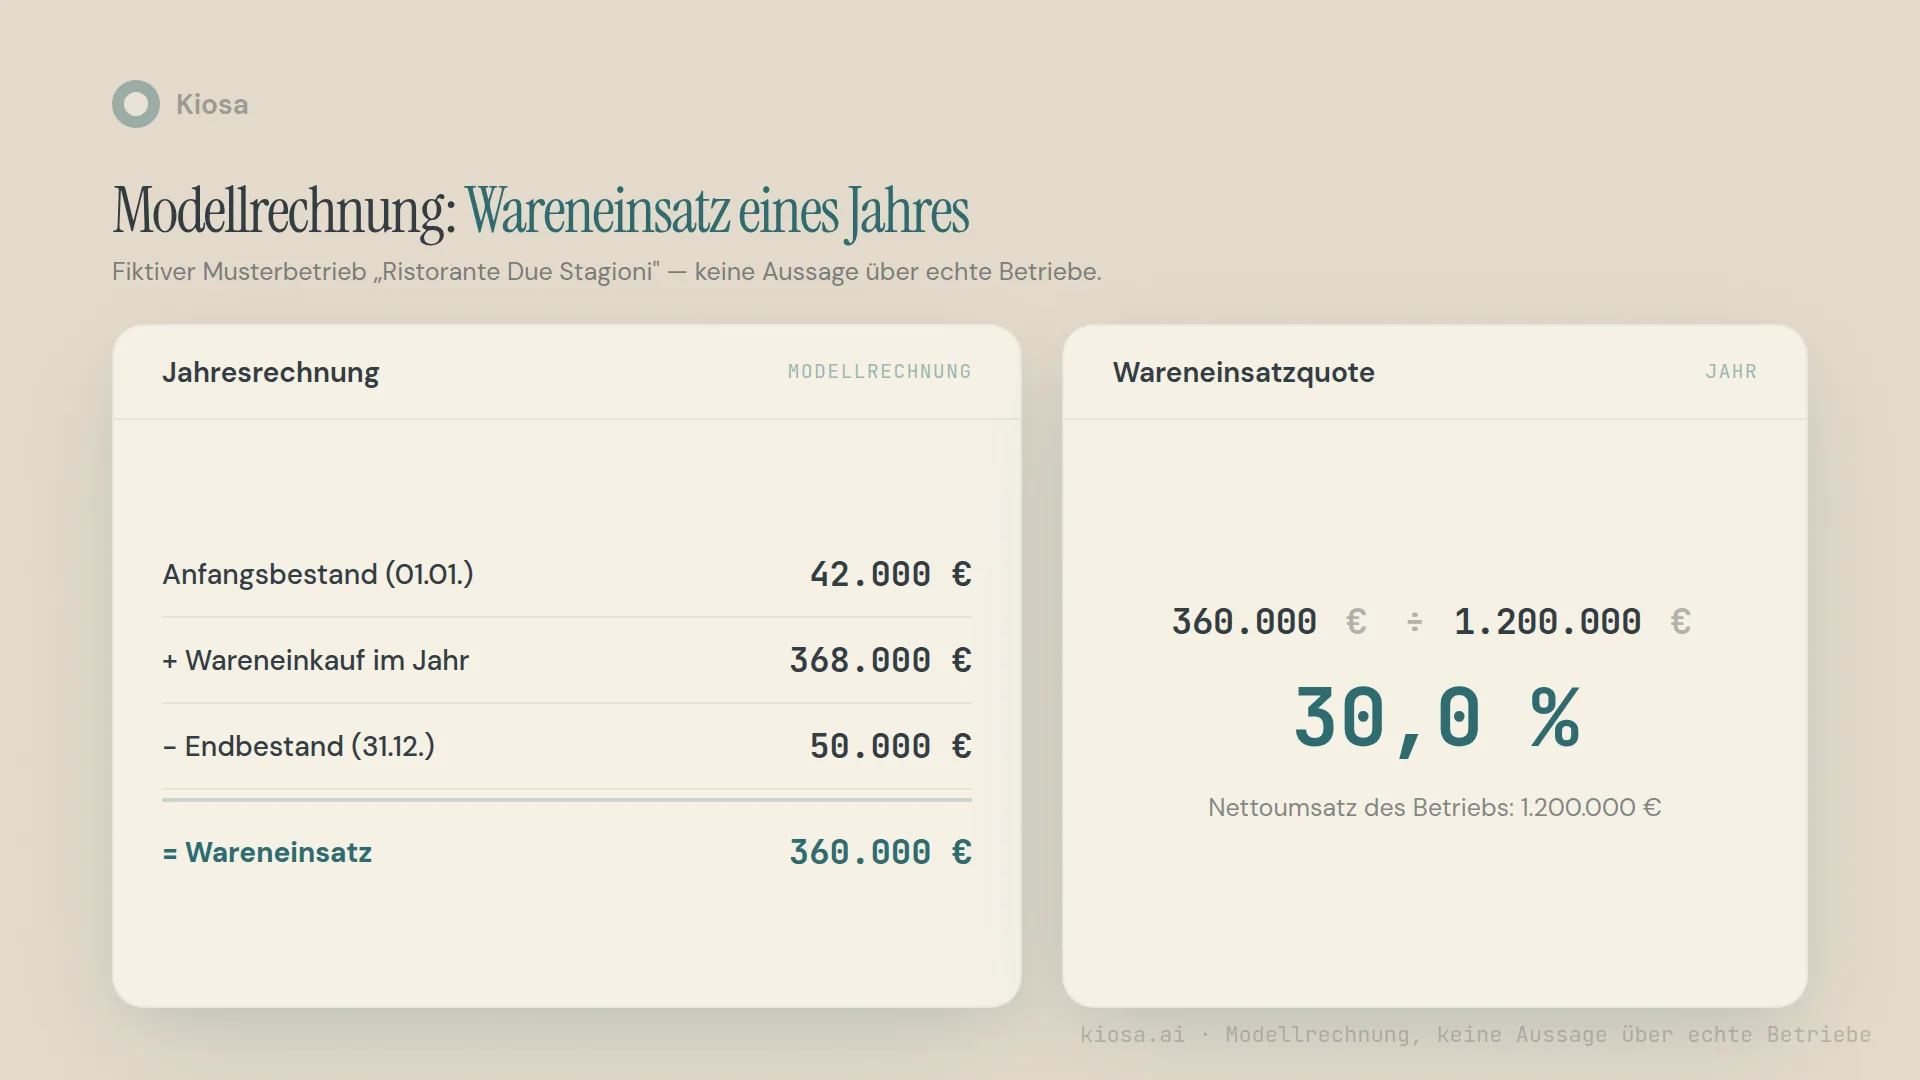
Into the formula: €42,000 + €368,000 − €50,000 = €360,000 food cost. The food cost percentage is €360,000 ÷ €1,200,000 = 30.0 per cent.
What does this show? Due Stagioni put more stock aside than it had at the start of the year. Purchases of €368,000 would therefore have been the wrong number for a food cost view; they would have overstated actual usage by €8,000. For a business that ran its stock down over the same period, it would be the other way round: purchases alone would have understated usage. That's exactly why the formula needs both stock values, not just the invoices.
Which mistakes distort food cost most often?
I see four sources of error again and again in practice, and they rarely occur alone.
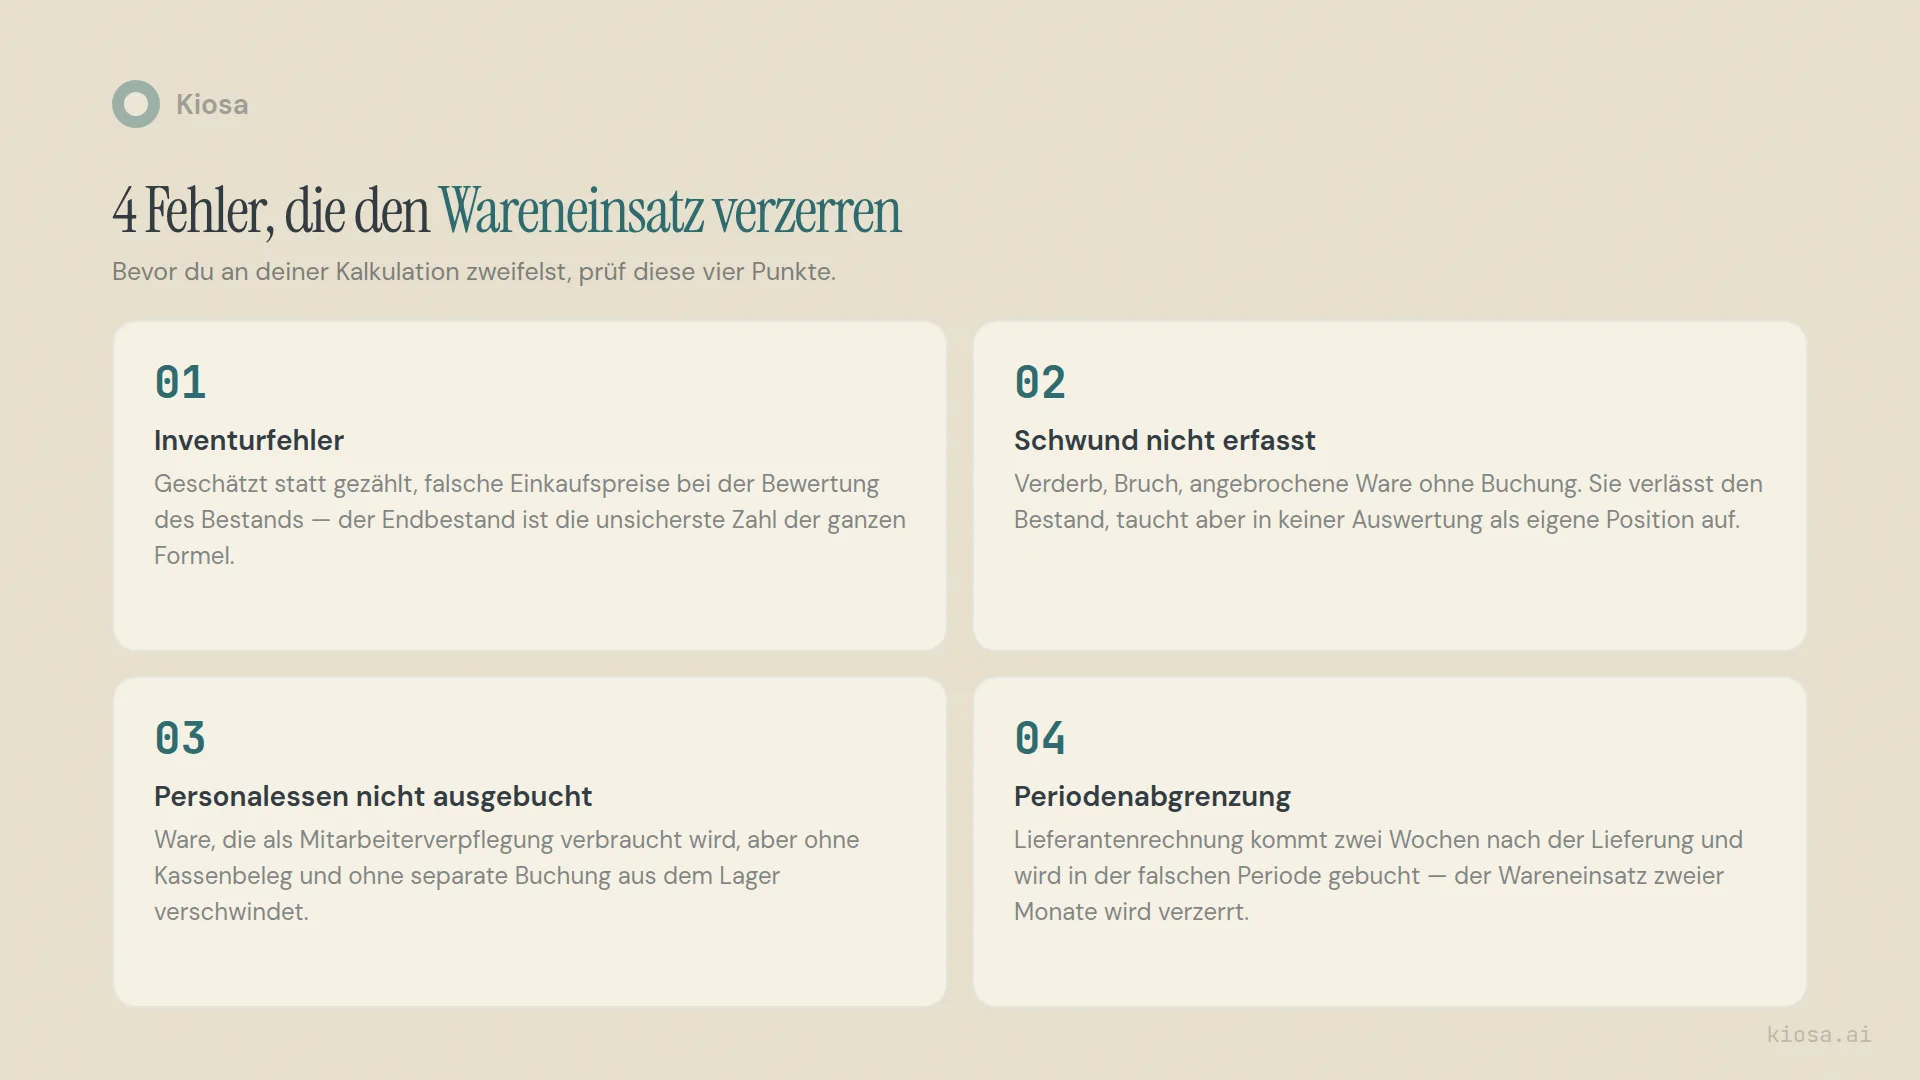
Stock count errors. Closing stock is the least certain number in the whole calculation, because it relies on a count. Estimated instead of counted, wrongly valued quantities, forgotten storage areas in the cellar or the walk-in outside: each of these errors shifts not only the current food cost but also the next one, because the wrong closing stock carries over as the opening stock of the following period.
Shrinkage not accounted for. Spoilage, breakage, opened bottles nobody wants to use. This stock leaves inventory without a sale against it. If it isn't recorded separately, it simply shows up in food cost, without it being clear how much of it was normal operation and how much could have been avoided.
Staff meals not recorded. Employees eat from the kitchen; in many businesses that's part of the deal. It becomes a problem when these withdrawals are neither booked as an item nor separated from the food cost analysis. Food cost rises, sales don't, and the percentage seems to worsen for no reason.
Period cut-off. A delivery arrives on the 28th of the month, but the invoice only comes two weeks later and is booked in the following month. The food cost actually belongs in the current month but shows up in the next. Over a year, this usually evens out. Within a single month-on-month comparison, it regularly causes confusion that nobody needs when they're trying to decide whether the kitchen is portioning too generously.
The most common mistake I see in practice isn't one of the four on its own, but the combination: nobody separates them cleanly, so at month end a variance lands on the table that comes from four different sources at once. Then people guess instead of proving.
How do you monitor food cost continuously instead of once a year?
An annual or monthly stock count shows you the sum of all errors of the past weeks. It doesn't tell you on which day something went wrong, and it usually comes too late for a correction.
The alternative: project theoretical food cost continuously from POS data, derived from portions sold and stored recipe costs, and set it against actual food cost at every stock count. In between, purchase values give early signals. That's the theoretical-vs-actual comparison, and it answers a different question from the plain food cost formula: not just how much was used, but whether that matches what should have been used.
The Kiosa Inventory module maps exactly this theoretical-vs-actual comparison, as an add-on to One View (€99) for €49 per location per month, with no setup fee. Kiosa doesn't replace your POS; it connects to it (official integrations: OktoPOS and Hypersoft), and sales data flows from your existing POS. Supplier invoices arrive in Kiosa by email. How to build this variance analysis in practice, and which tolerances are realistic, is described in detail in the article on actual vs. theoretical food cost.
For a first assessment, though, the simple formula from this article, worked through cleanly once, is often enough. The food cost calculator does it in a few minutes, without a spreadsheet.
Everything on Food cost and inventory
- Actual vs Theoretical Food Cost: Formula and Worked Example
- Restaurant Supplier Price Increases: How to Spot the Silent Ones
- Menu Engineering: How to Analyse Your Menu Like a Controller
- Restaurant Menu Pricing: From Food Cost to Selling Price
- Restaurant Inventory Count: How Often, What to Count + Free Template
- Contribution Margin per Dish: Calculate CM1 and CM2
- Restaurant Menu Price Increase: From Supplier Price to Menu Price
- Menu Item Sales Analysis: Step by Step with a Worked Example
- Restaurant Recipe Costing: Food Cost per Dish, Step by Step
- Restaurant Shrinkage: Where the Percentage Points Disappear
- Restaurant Inventory Management System: Cost and When It Pays Off
Related on kiosa.ai:
From analysis to action
What this is about: calculating food cost and the food cost percentage with formula and example.
Put it into practice: Kiosa Inventory for the ongoing actual vs. theoretical comparison
FAQ
How do you calculate food cost in a restaurant?
With the formula opening stock plus purchases in the period minus closing stock. All three values in euros, at purchase prices. For opening and closing stock you need a stock count or a rolled-forward stock valuation; for purchases, the total of your supplier invoices in the period.
What is a good food cost percentage?
That depends heavily on the concept type. A pizzeria, a steakhouse and a cocktail bar have structurally different targets, because their product costs per dish or drink are completely different. A range by product group is in the food cost ratio glossary entry. More important than comparing with an industry figure is comparing with your own costing: if the actual percentage deviates clearly from what your recipes specify, that's where the real problem lies.
What is the difference between food cost and food cost percentage?
Food cost is a euro amount: the value of stock used. Food cost percentage is a percentage: food cost relative to net sales. Two businesses with the same percentage can still have very different euro amounts at risk, depending on how large their sales are.
How often should I calculate food cost?
At least monthly, with a full stock count. For a real early warning, though, that isn't enough. An ongoing theoretical value from POS data and recipe costs, set against a count more often for critical product groups, shows you a variance earlier, not just as a total at month end.
Which mistakes distort the food cost calculation most often?
In practice usually a combination of four sources: inaccurate stock counts, unrecorded shrinkage, unrecorded staff meals and wrong period cut-off for supplier invoices. Individually they're usually small; together they can shift the percentage by several percentage points.
Your next steps
This week: For the last full month, pull your three numbers – opening stock, purchases, closing stock – and calculate food cost once by hand. Divide it by your net sales for the same month. That one number is your starting point for everything else.
Food cost calculator – Calculate your current food cost percentage in a few minutes and compare it with your own trend and your recipe costs.
Actual vs. theoretical food cost: where your money disappears – If the one-off calculation shows that closer control pays off: how to build the ongoing variance analysis.
30 minutes well spent. Want to see what the theoretical-vs-actual comparison looks like for your locations, with your recipes and your POS data instead of slides? Book a demo call and I'll show you with a real example.
Related terms
- Food cost ratio – formula, benchmarks by concept type and how to monitor it automatically
- Contribution margin – the metric that shows whether lower food cost really means more profit
- Restaurant prime cost – food cost and labor cost considered together, the overarching steering metric
