Calculating contribution margin in a restaurant takes two steps, not one: CM1 per dish is the net selling price minus food cost, and CM2 then deducts directly attributable costs such as packaging or delivery fees. Only CM1 minus labor cost at the location gives you the operating contribution margin that has to cover rent and profit. CM1 is only as accurate as the food cost you deduct: the formula and a worked example are in how to calculate food cost percentage.
Most business textbooks finish the calculation in one line: revenue minus variable costs. For a business with a menu, several locations and, increasingly, several sales channels, that is not enough. This article works through both levels completely, per dish and per location, using a fictitious sample menu and a fictitious multi-location comparison.
Contents
- What is contribution margin, and why is one number not enough?
- How do you calculate CM1 per dish?
- How do you calculate CM2 per dish?
- Worked example: CM1 and CM2 for 6 dishes
- From dish to location: how do you calculate contribution margin for the whole business?
- What is a good contribution margin?
- What do you do with a contribution margin that is too low?
- Once a year is not enough: how to track contribution margin continuously
- FAQ
- Your next steps
What is contribution margin, and why is one number not enough?
Contribution margin shows what is left of revenue after certain costs are deducted. That is the general business definition, and it applies to a car repair shop just as much as to a restaurant. It only becomes interesting when you apply it to hospitality. There you calculate on two completely different levels, which are often mixed up.
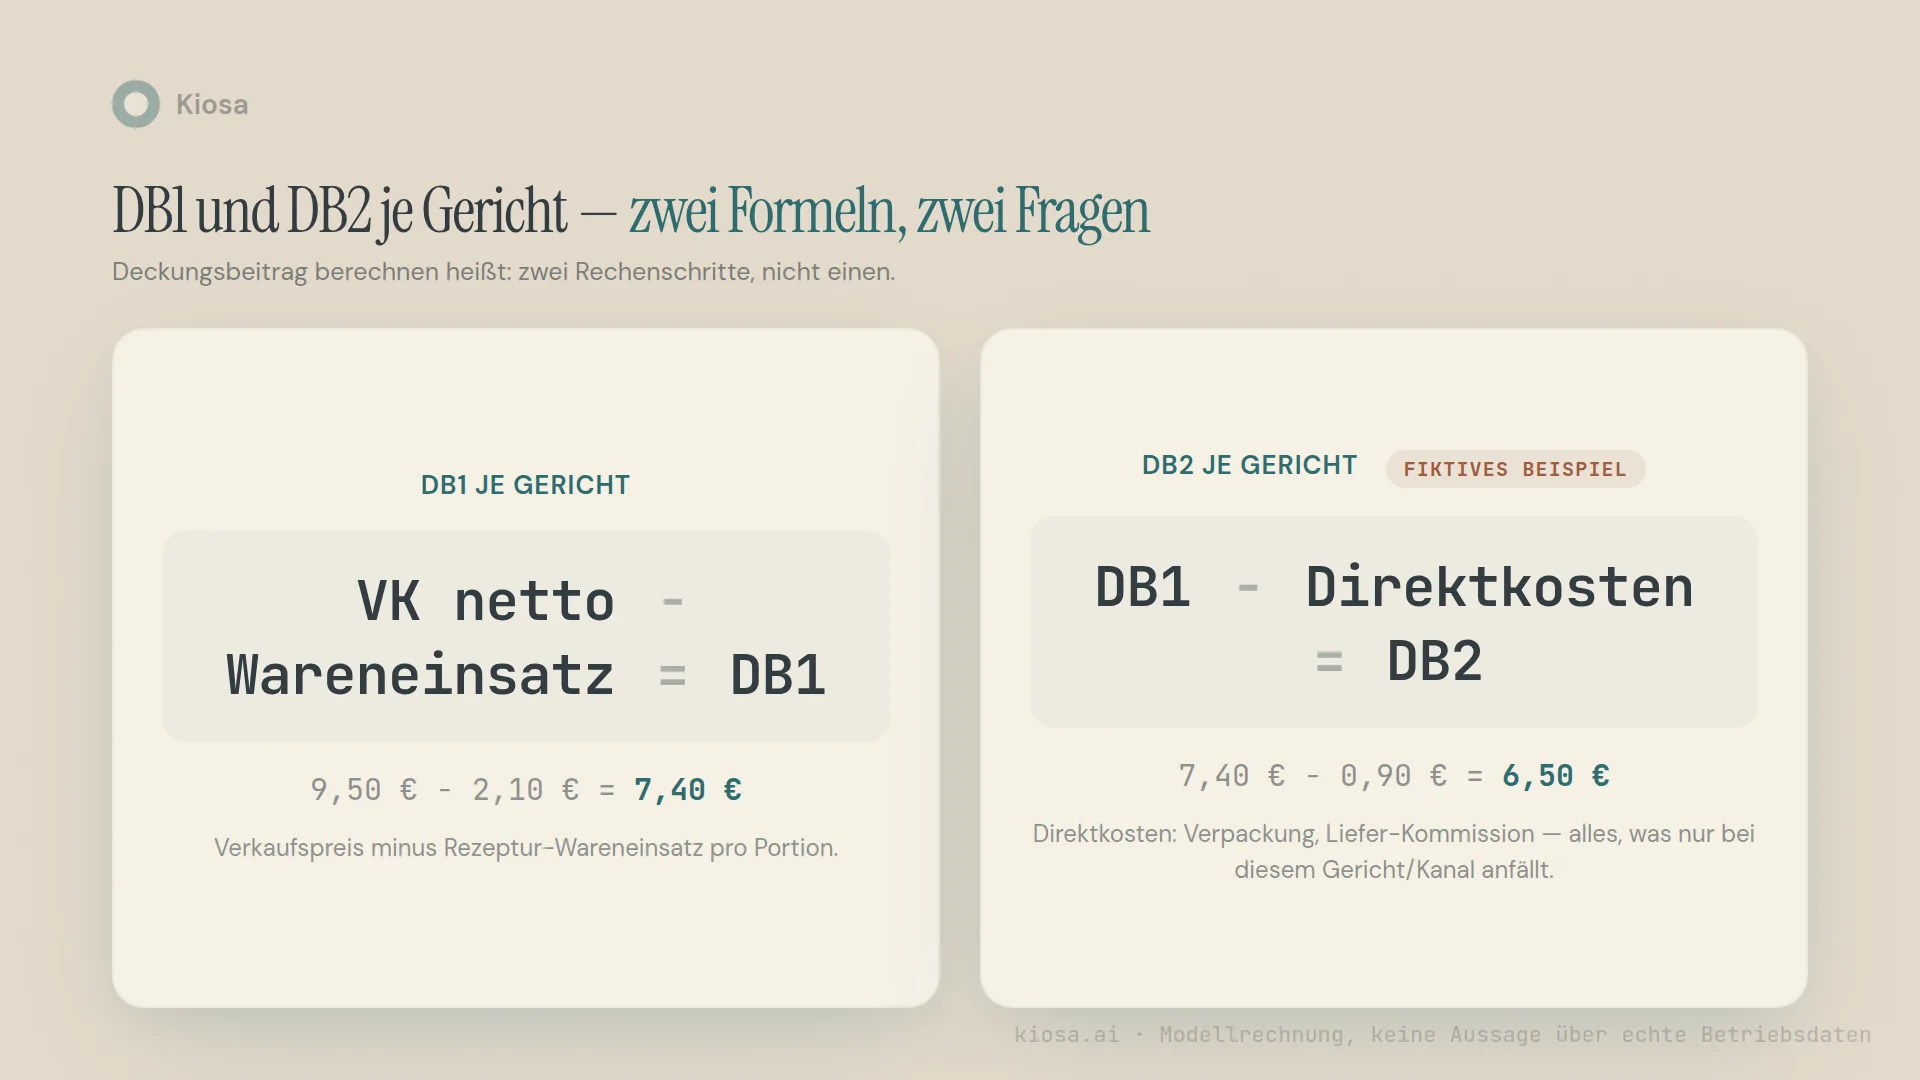
Level 1: per dish. Every single dish on your menu has its own contribution margin. Selling price minus food cost, full stop. This number answers the question: which dish is worth it, and which one is just along for the ride?
Level 2: per location. The operating contribution margin adds up all portions sold and then deducts labor cost. This number answers a different question: does the location cover its fixed costs in the end (rent, energy, insurance), with profit left over?
In our glossary you will find this second level under the abbreviations DB I and DB II, with Roman numerals, from the German term Deckungsbeitrag. In this article I write CM1 and CM2, and I also split the first level, the contribution margin per dish, into two calculation steps. It is the same principle, just broken down more finely, all the way to the single portion.
The difference from the food cost ratio matters here: the food cost ratio shows food cost as a percentage of sales, a relative number. Contribution margin shows what is left in euros, an absolute number. The two belong together, but only one of them pays the rent at the end of the month.
How do you calculate CM1 per dish?
The formula could hardly be simpler:
CM1 = net selling price − food cost per portion
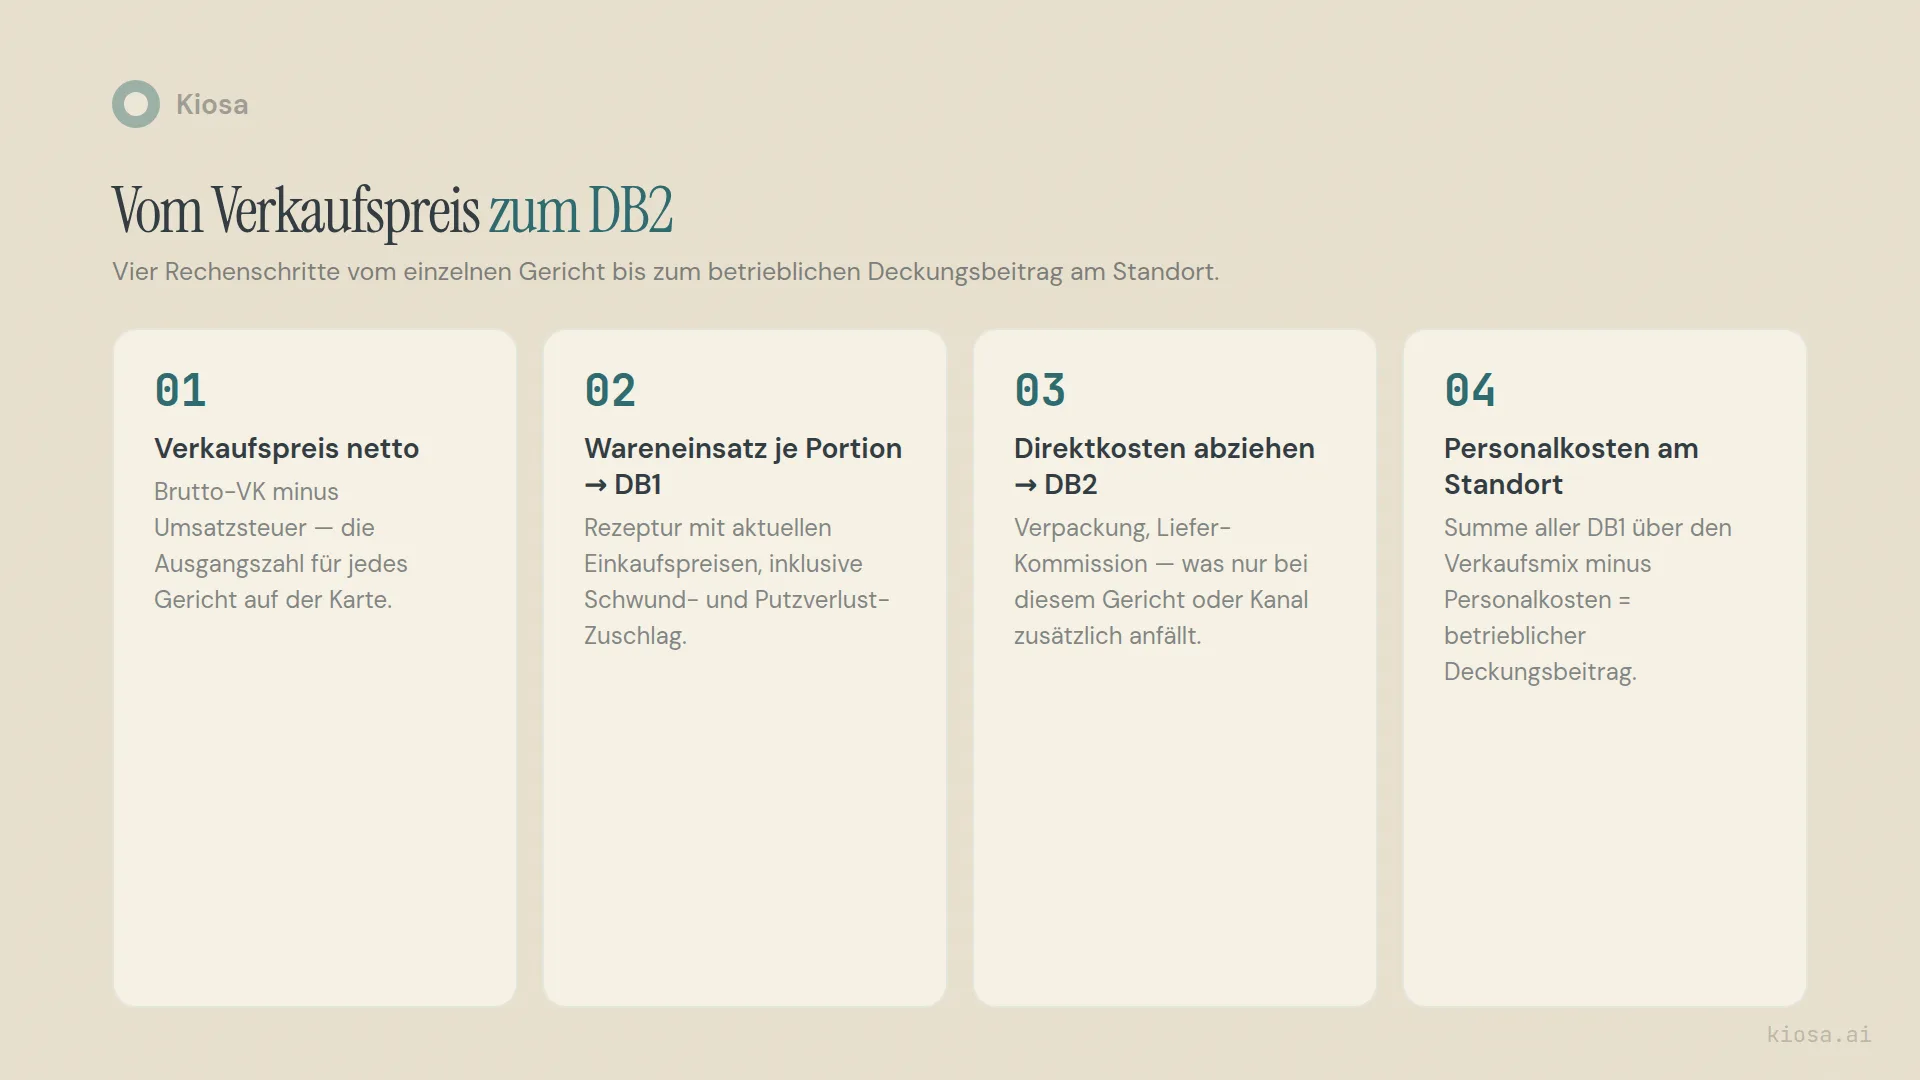
Two things need to be done properly. First: net selling price, not gross. Sales tax is a pass-through item; it does not belong to you and so does not belong in your margin calculation. Second: food cost per portion is more than the main ingredient. It covers the full recipe: sides, sauces, seasoning, garnish, valued at current purchase prices, plus a realistic allowance for waste and trim loss. If you only count the main ingredient, you are flattering your margin.
If your recipe costing has gaps, or purchase prices have risen since the last costing without the menu being updated, this is the right place to start: the food cost calculator walks you through the calculation for a single dish, including a waste allowance.
How do you calculate CM2 per dish?
This is where the generic textbook definition stops and everyday restaurant life begins. Many businesses now sell the same dish through several channels: at the table, as takeaway, via a delivery platform. On paper a dish has a single CM1. In practice, what actually remains depends on how it leaves the building.
CM2 = CM1 − directly attributable costs
Directly attributable costs are all additional costs that arise only for this dish or this sales channel and can be clearly assigned, unlike rent or energy, which the whole business shares. The most common in practice:
- Packaging. A dish that mostly goes out as takeaway or delivery needs containers, lids and bags. A soup needs a leak-proof cup, a pizza its own box.
- Delivery commission. Delivery platforms charge a commission per order as a percentage of the order value; the rate depends on the contract and on whether you deliver yourself or the platform does. If a dish is mainly sold through this channel, a proportional commission amount belongs in its CM2 calculation.
- Portion-related extra work. For dishes prepared at their own live station, such as carving or flambéing at the table, part of the preparation time can be cleanly assigned to the individual dish instead of disappearing into the general split of kitchen hours.
The most common mistake I see in multi-channel businesses: a dish is costed once, with a single CM1 value. That value then goes unchanged into the menu analysis, whether the dish is sold at the table or through a platform with a hefty commission. Two dishes with identical CM1 can have a completely different CM2 after direct costs, simply because they go out through different channels in different proportions.
Worked example: CM1 and CM2 for 6 dishes
To keep this concrete, here is a complete model calculation. The business is entirely made up: a fictitious Trattoria da Enzo with six main items. It says nothing about real operating data.
| Dish | Net price | Food cost | CM1 | Direct costs | CM2 | CM2 margin |
|---|---|---|---|---|---|---|
| Pizza Margherita | €9.50 | €2.10 | €7.40 | €0.90 | €6.50 | 68.4% |
| Rib-eye steak 300g | €28.00 | €11.20 | €16.80 | €0.00 | €16.80 | 60.0% |
| Caesar salad | €12.50 | €3.75 | €8.75 | €0.60 | €8.15 | 65.2% |
| Soup of the day | €6.00 | €1.20 | €4.80 | €0.70 | €4.10 | 68.3% |
| Classic burger | €14.50 | €4.35 | €10.15 | €1.10 | €9.05 | 62.4% |
| Tiramisu | €7.50 | €1.50 | €6.00 | €0.30 | €5.70 | 76.0% |
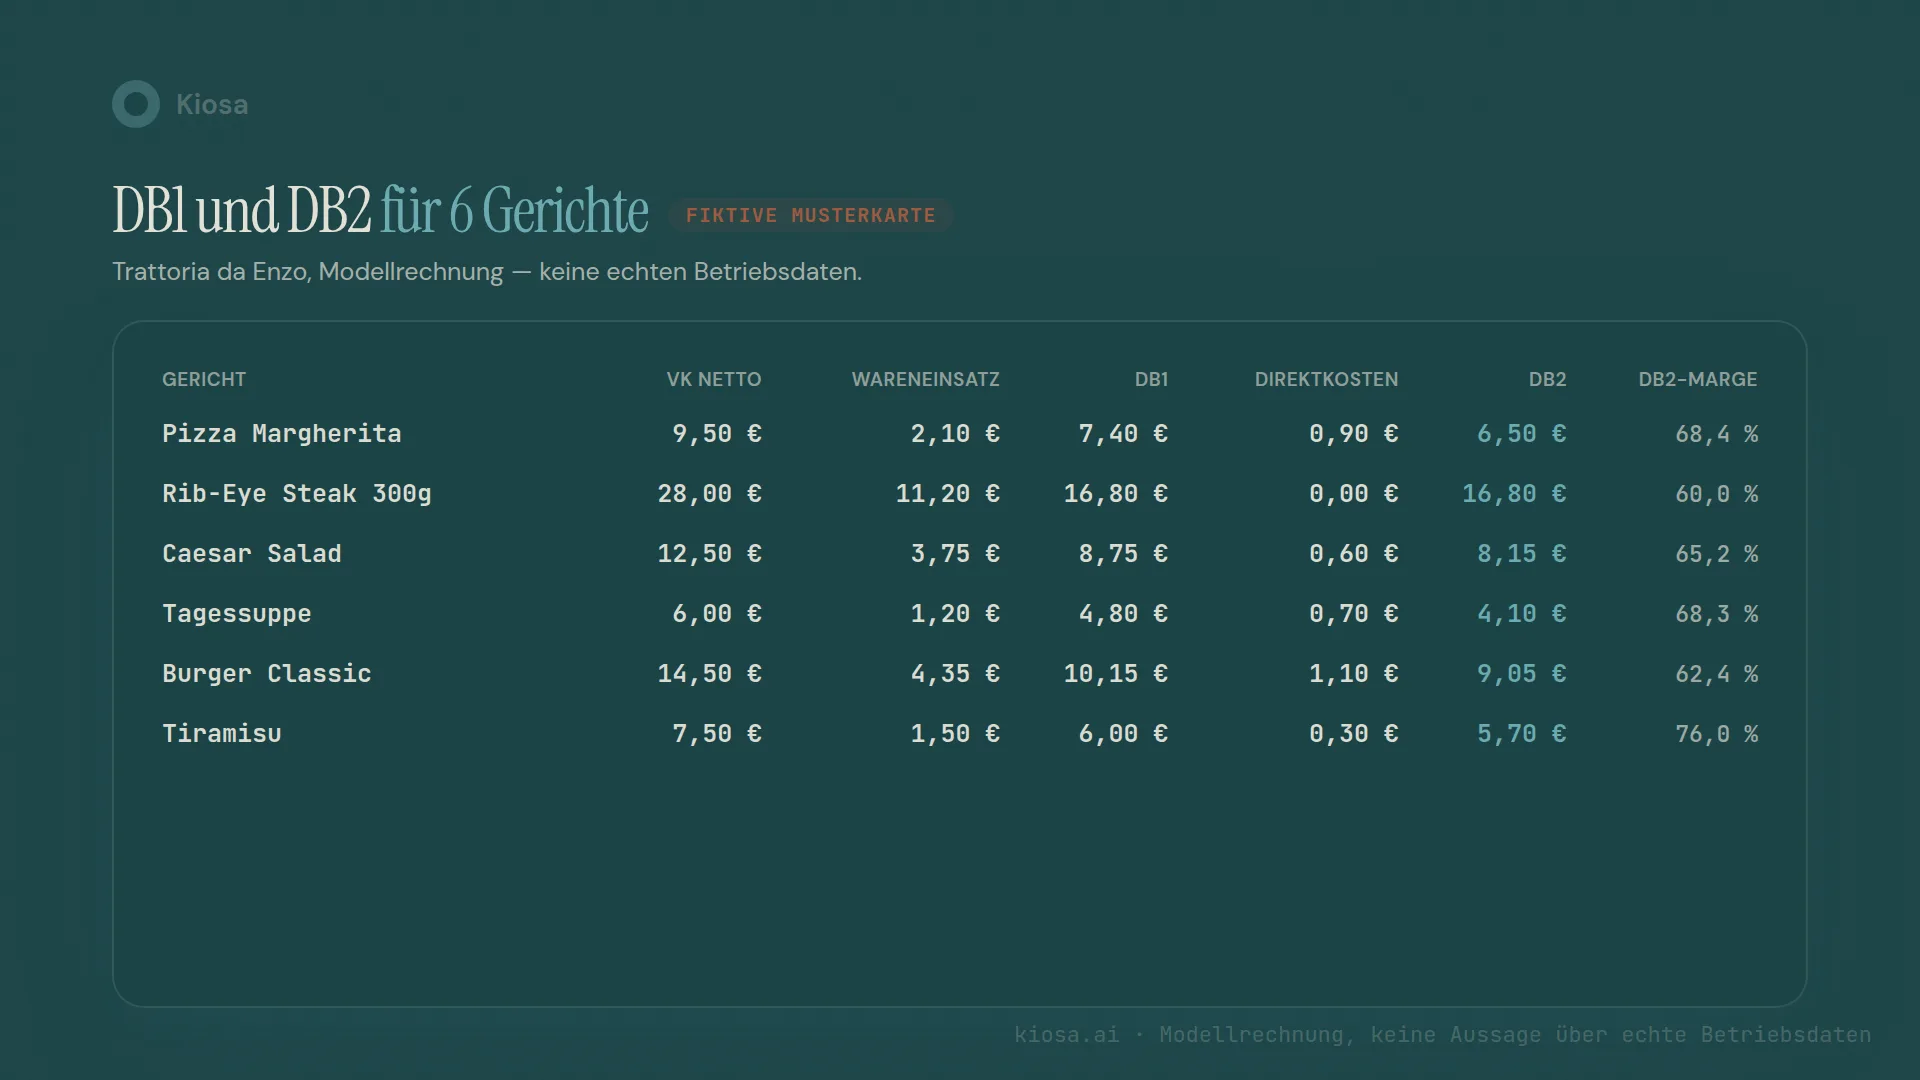
The model: on this sample menu the steak is sold only at the table, with no delivery and no packaging, which is why its direct costs are €0.00. Soup and burger, by contrast, go out through the delivery platform to a significant extent, so cups, lids and the commission share take noticeably more off.
Two things stand out on this sample menu. First: the most expensive dish, the steak at €16.80, brings the highest absolute CM2 in euros, but at 60 percent the lowest margin. Second: tiramisu brings in little in euros at €5.70 (the soup of the day brings the least at €4.10), but at 76 percent it has by far the best margin. Which number matters more depends on what you are deciding. The same distinction drives menu item sales analysis: for pricing by menu section the margin often counts, for a pure contribution ranking of the menu the absolute euro amount counts.
From dish to location: how do you calculate contribution margin for the whole business?
The dish level is the building block. The operating contribution margin is the sum. For a location:
CM1 (location) = net sales − total food cost CM2 (location) = CM1 (location) − labor cost
This is exactly the definition in the glossary, only now not for a single dish but for the sales mix of a complete location over a period. Worked example, fictitious location Opus Grill:
| Item | Amount | Share |
|---|---|---|
| Net sales / month | €150,000 | 100.0% |
| Food cost | €42,000 | 28.0% |
| CM1 | €108,000 | 72.0% |
| Labor cost | €54,000 | 36.0% |
| CM2 | €54,000 | 36.0% |
| Fixed costs (rent, energy, insurance) | €36,000 | 24.0% |
| Operating result | €18,000 | 12.0% |
Labor cost is the second-biggest lever here after food cost. In Germany, the hospitality association DEHOGA puts labor cost in many traditional full-service restaurants at over 40 percent of sales (DEHOGA, quoted by Tageskarte, 2 September 2025, retrieved 10 November 2026). That is exactly why CM1 alone is not enough to manage a location: a location with low food cost but overstaffed shifts looks good on CM1 and bad on CM2.
This becomes especially clear when you put two locations side by side:
| Location | Net sales | CM1 | CM1 margin | Labor cost | CM2 | CM2 margin |
|---|---|---|---|---|---|---|
| Opus Grill Old Town | €150,000 | €108,000 | 72.0% | €54,000 | €54,000 | 36.0% |
| Opus Grill Harbour | €210,000 | €132,300 | 63.0% | €79,800 | €52,500 | 25.0% |
Harbour takes 40 percent more than Old Town and even delivers a higher CM1. After labor cost the picture flips: at €52,500 CM2, Harbour ends up below Old Town in absolute terms, despite significantly higher sales. If you only look at sales or only at CM1, you would think Harbour is the stronger location. Only CM2 shows which location actually contributes more to the result. That is the whole point of the second level.
What is a good contribution margin?
There is no blanket euro figure. A city-centre location with high rent needs a higher CM2 than a location on a side street to end up with the same profit margin. What you can compare well, by contrast, is the CM2 margin as a percentage of sales.
This is where prime cost helps: it is food cost plus labor cost relative to sales, the direct complement to the CM2 margin. If your prime cost is 60 percent, your CM2 margin is automatically 40 percent. At what prime cost things get critical, and how that differs by concept type, is covered in detail in the article on restaurant prime cost.
The dish level follows a different logic: drinks structurally have a much higher CM2 margin than mains because their food cost is low. Comparing the CM2 margin of a pasta dish with that of a wine therefore tells you little. The meaningful comparison is within the same category: main against main, dessert against dessert. Where exactly the line between a sustainable and a critical contribution margin lies also depends on the location's break-even point: the higher the fixed costs, the higher the average CM2 margin across the whole menu has to be.
What do you do with a contribution margin that is too low?
Four levers, in the order I usually check them:
Price. The most direct lever, but not one to pull blindly: a dish just below a psychological price threshold can often take a moderate increase before demand drops noticeably.
Recipe and portion. Reduce or replace an expensive ingredient, adjust the portion size, rethink the sides. Often a single change is enough to lift a dish above a relevant margin threshold without guests noticing the difference.
Channel mix. If a dish only has a weak CM2 margin because of the delivery commission, it is worth asking whether it suits the delivery channel at all, or whether a minimum order value, a channel-specific surcharge or simply removing it from the delivery menu is the better solution.
Position on the menu. A dish with a solid CM2 that hardly anyone orders does not have a price problem but a visibility problem. This is exactly where menu item sales analysis comes in: it links contribution margin with sales volume and shows which dish you should reposition instead of cutting. How to align the whole menu systematically, from price architecture to descriptions to placement, is covered in the article on menu engineering. For the price side of the calculation, see the article on restaurant menu pricing.
Once a year is not enough: how to track contribution margin continuously
The classic contribution margin calculation is a spreadsheet exercise, usually done once a year when the menu is revised. A lot changes in between: purchase prices fluctuate, a dish's share of delivery shifts, a commission goes up. The annual calculation only sees this with a long delay.
Kiosa connects to your POS (officially OktoPOS and Hypersoft) without replacing it, and pulls quantity sold and selling price per dish automatically. Through the Inventory module the system also knows the current food cost per recipe: when a purchase price changes, the dish costing is recalculated automatically. The actual vs theoretical food cost comparison between recipe and actual usage runs with every stock count. CM1 per dish is therefore always up to date, not just at the next menu revision. In One View, sales, food cost and labor cost come together per location: the basis for seeing CM2 at location level continuously rather than once a quarter.
That does not replace the decision about which lever to pull on a weak dish. You still make that decision. But you make it based on numbers that are correct this week.
From analysis to action
What this is about: calculating and tracking CM1 and CM2 per dish and per location.
Put it into practice: Kiosa Inventory with recipe costs per dish
More on Food cost and inventory
- Food Cost Percentage Formula: Calculation, Example, Calculator
- Menu Engineering: How to Analyse Your Menu Like a Controller
- Restaurant Menu Pricing: From Food Cost to Selling Price
FAQ
What is the difference between CM1 and CM2?
CM1 is the net selling price minus food cost, the pure material margin of a dish. CM2 additionally deducts directly attributable costs, meaning costs that arise clearly and only for this dish or channel, such as packaging or delivery commission. At location level CM2 is usually defined differently: there it is CM1 minus the location's total labor cost.
How do I calculate contribution margin per dish?
Net selling price minus recipe food cost, including all ingredients, sides and a realistic waste allowance. The food cost calculator walks you step by step through the calculation for a single dish.
Is a high contribution margin always good?
The absolute euro figure and the percentage margin tell different stories. An expensive dish can bring the highest CM2 in euros and still have the weakest margin because its food cost share is high. Which of the two numbers counts for your decision depends on whether you want to strengthen the menu overall (euros) or compare individual dishes within a category (percentage).
Contribution margin or food cost ratio: which tells you more?
They belong together but show different things. The food cost ratio shows food cost as a percentage of sales, a relative KPI that is good for comparisons over time or between dishes in a similar price range. Contribution margin shows what is left in euros: the number that actually pays rent and staff in the end.
How often should I calculate contribution margin?
Per dish, ideally continuously, whenever purchase prices or channel mix change. An annual menu revision on its own often notices price increases months too late. Per location, a weekly or monthly rhythm is enough, aligned with your reporting cycle for sales and labor cost.
Your next steps
Food cost calculator: the foundation of every CM1. Calculate food cost per dish with current purchase prices.
P&L analyzer: bring together a location's labor cost, food cost and fixed costs to put CM2 at location level into context.
30 minutes well spent. Want to see CM1 and CM2 continuously from your POS and food cost data instead of rebuilding them in a spreadsheet every year? Book a demo call and I will show you on real data what that looks like.
Related terms
- Contribution margin: definition, formula and example at location level
- Food cost ratio: food cost relative to sales, the relative counterpart to contribution margin
- Prime cost: food cost plus labor cost, the complement to the CM2 margin
- Menu engineering: contribution margin per dish as the basis for classifying your menu
