A menu item sales analysis sorts your menu by quantity sold and contribution margin into four quadrants: Stars, Plowhorses, Puzzles and Dogs. You only need two numbers per dish: the quantity from your POS and the contribution margin from your costing, which is built on a cleanly calculated food cost. The median of both values is the threshold. Further down, I work through a complete sample menu for you.
Contents
- What is a menu item sales analysis?
- Step by step: how to build your own analysis
- The worked example: a sample menu with 12 dishes
- What do you do with the Dogs?
- Menu item sales analysis vs. menu engineering: what's the difference?
- Once a year isn't enough: how to do it continuously
- FAQ
- Your next steps
What is a menu item sales analysis?
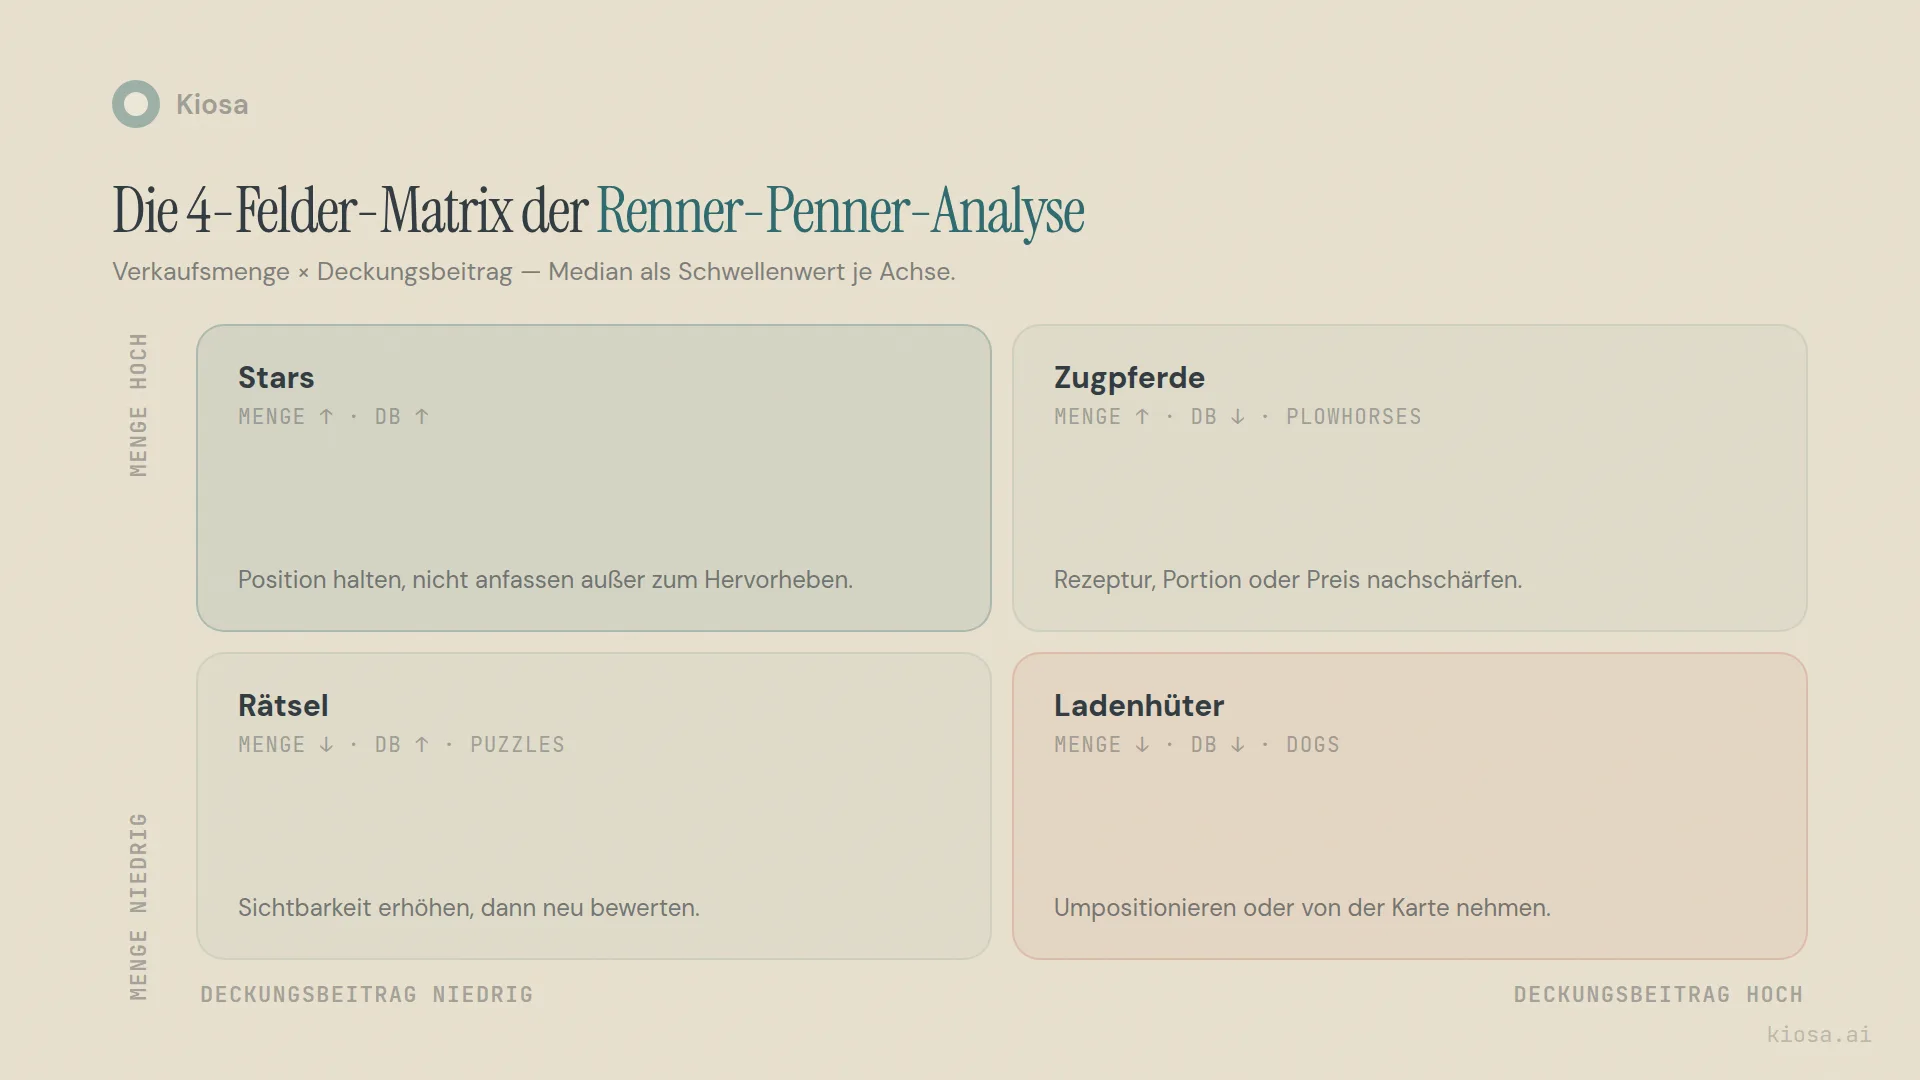
A menu item sales analysis classifies every dish on your menu along two axes: how often is it sold, and how much does it leave you with? The second number is the contribution margin per portion, meaning selling price minus food cost according to the recipe. Together, the two axes give four quadrants:
- Stars: sell well and bring margin. Leave them alone, except to show them off.
- Plowhorses: sell well, but bring little margin. Your biggest quiet lever.
- Puzzles: bring margin, but hardly sell. Not lost yet.
- Dogs: weak on both. This is where you clear out.
A plain sales ranking only covers the first axis: the ranking by quantity, best-sellers against slow-sellers, without looking at margin. In practice, when operators talk about this kind of analysis today, they almost always mean the full 2x2 matrix with contribution margin, because only the two dimensions together give a recommendation for action. A dish that goes out 400 times a month but earns nothing isn't a best-seller. It's a Plowhorse you urgently need to re-cost.
This is exactly the matrix I work through completely in this article, including a sample menu. How it differs from the broader discipline of menu engineering is explained further down.
Step by step: how to build your own analysis
Four steps, none of them needs special software. A spreadsheet is enough.
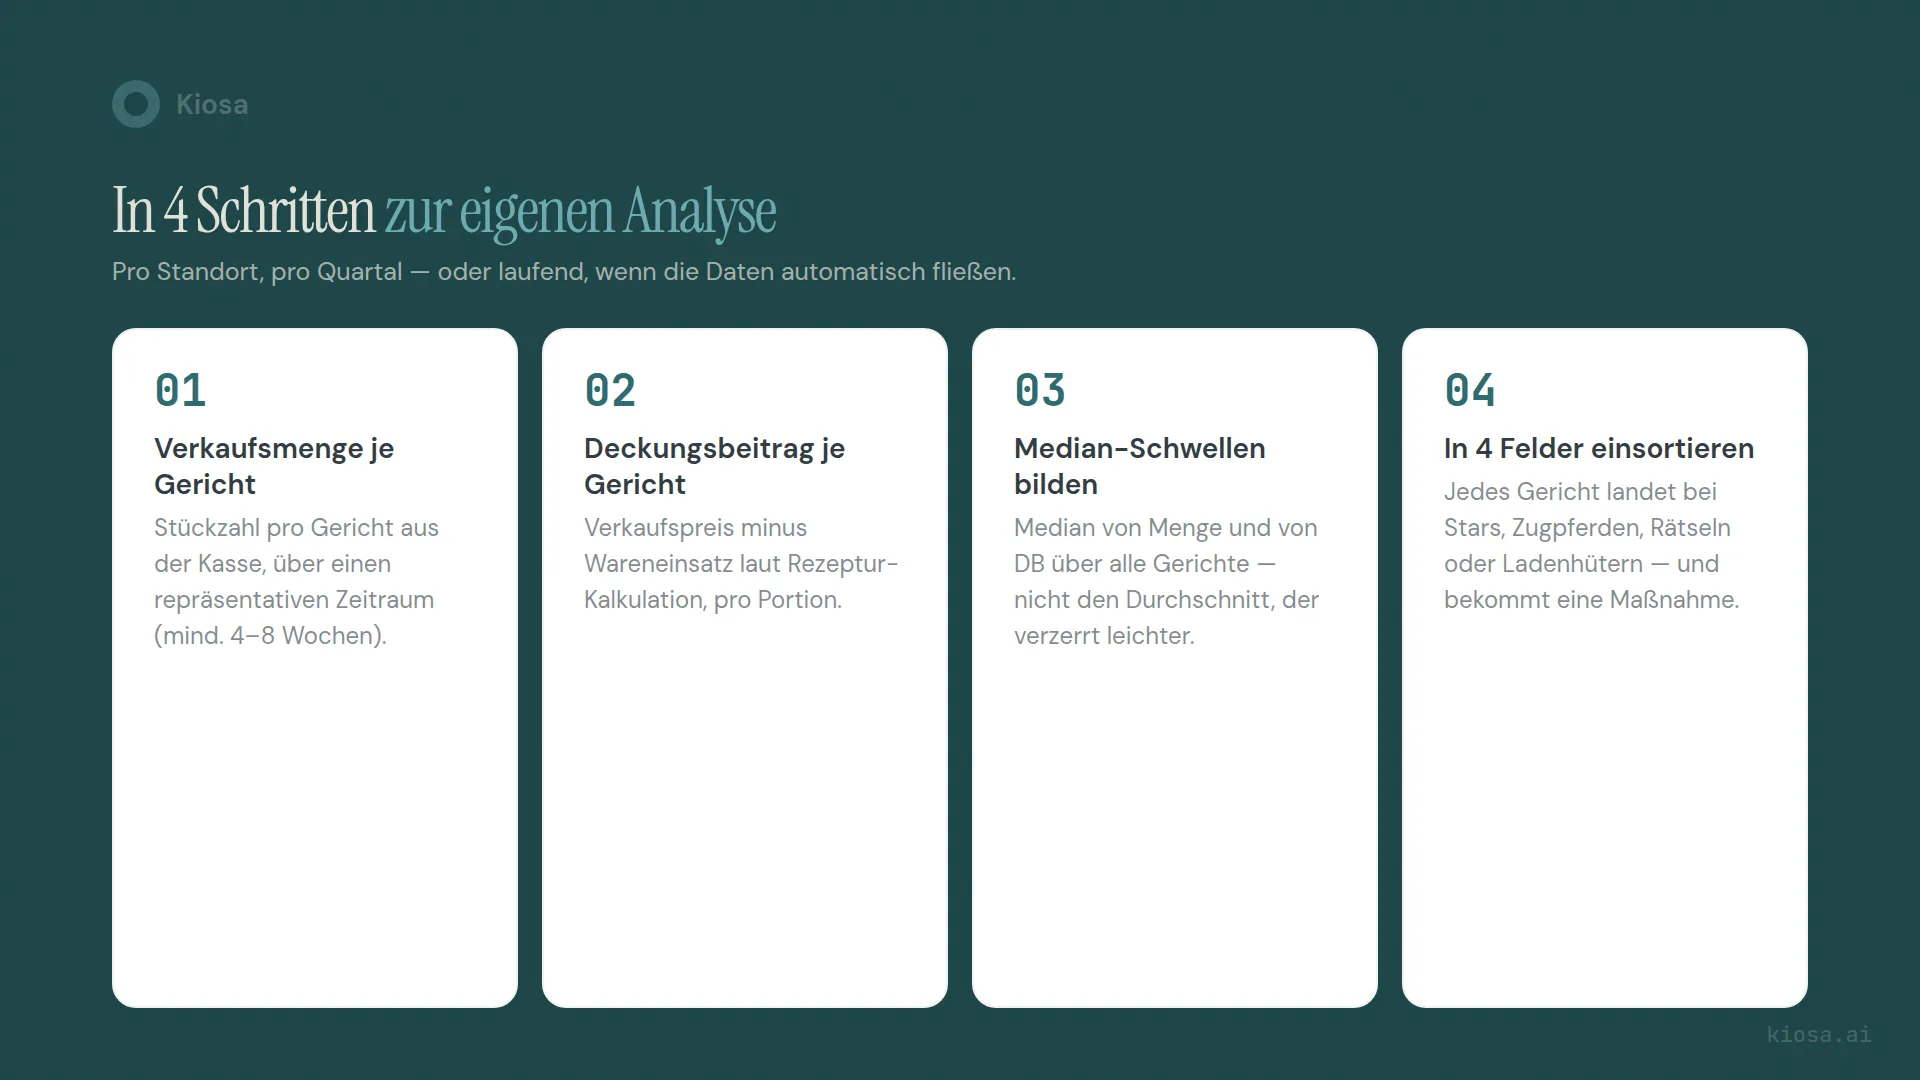
Step 1: get the quantity sold per dish. Pull the quantity per dish from your POS for a representative period. Four to eight weeks is a good guide; shorter periods quickly tip into random noise on seasonal menus. Important: either consistently combine sides and variants or consistently separate them, otherwise you distort both sides of the matrix.
Step 2: calculate contribution margin per dish. Selling price minus food cost according to the recipe, including sides, sauces and a realistic waste allowance. If your recipe costing has gaps, that's the best place to start: the food cost calculator walks you through the calculation per dish.
Step 3: set median thresholds. Sort all dishes by quantity and take the median, then do the same for contribution margin. Take the median, not the average. A single outlier dish with record sales pulls the average up and, in the worst case, pushes half the menu below the threshold, even though nothing has changed about their actual position. That's the most common mistake I see in first-time analyses: people calculate the mean and wonder why suddenly almost nothing is a Star any more.
Step 4: sort into four quadrants. Every dish lands above or below each threshold, which automatically gives it a quadrant. No dish stays unclassified, and every quadrant gets a clear next action, not just an observation.
The worked example: a sample menu with 12 dishes
So this doesn't stay abstract, here's a complete model calculation. The business is entirely made up: a fictional trattoria with twelve mains on the menu, sales figures over a model month. No statement about real business data.
| Dish | Quantity/month | Contribution margin | Quadrant |
|---|---|---|---|
| Spaghetti bolognese | 420 | €4.80 | Plowhorse |
| Pizza margherita | 390 | €5.20 | Star |
| Lasagne al forno | 310 | €4.50 | Plowhorse |
| Pizza diavola | 280 | €5.60 | Star |
| Insalata caprese | 150 | €3.20 | Plowhorse |
| Bruschetta trio | 130 | €2.90 | Plowhorse |
| Gnocchi gorgonzola | 95 | €3.60 | Dog |
| Risotto ai frutti di mare | 70 | €9.10 | Puzzle |
| Tagliatelle al tartufo | 60 | €7.90 | Puzzle |
| Vitello tonnato | 55 | €6.80 | Puzzle |
| Ossobuco | 45 | €8.40 | Puzzle |
| Saltimbocca | 40 | €4.10 | Dog |
First the quantities sorted: 40, 45, 55, 60, 70, 95, 130, 150, 280, 310, 390, 420. With twelve values, the median is the mean of the sixth and seventh values, so (95 + 130) ÷ 2 = 112.5 portions. Then contribution margin sorted: €2.90 to €9.10, median again from positions six and seven, (4.80 + 5.20) ÷ 2 = €5.00.
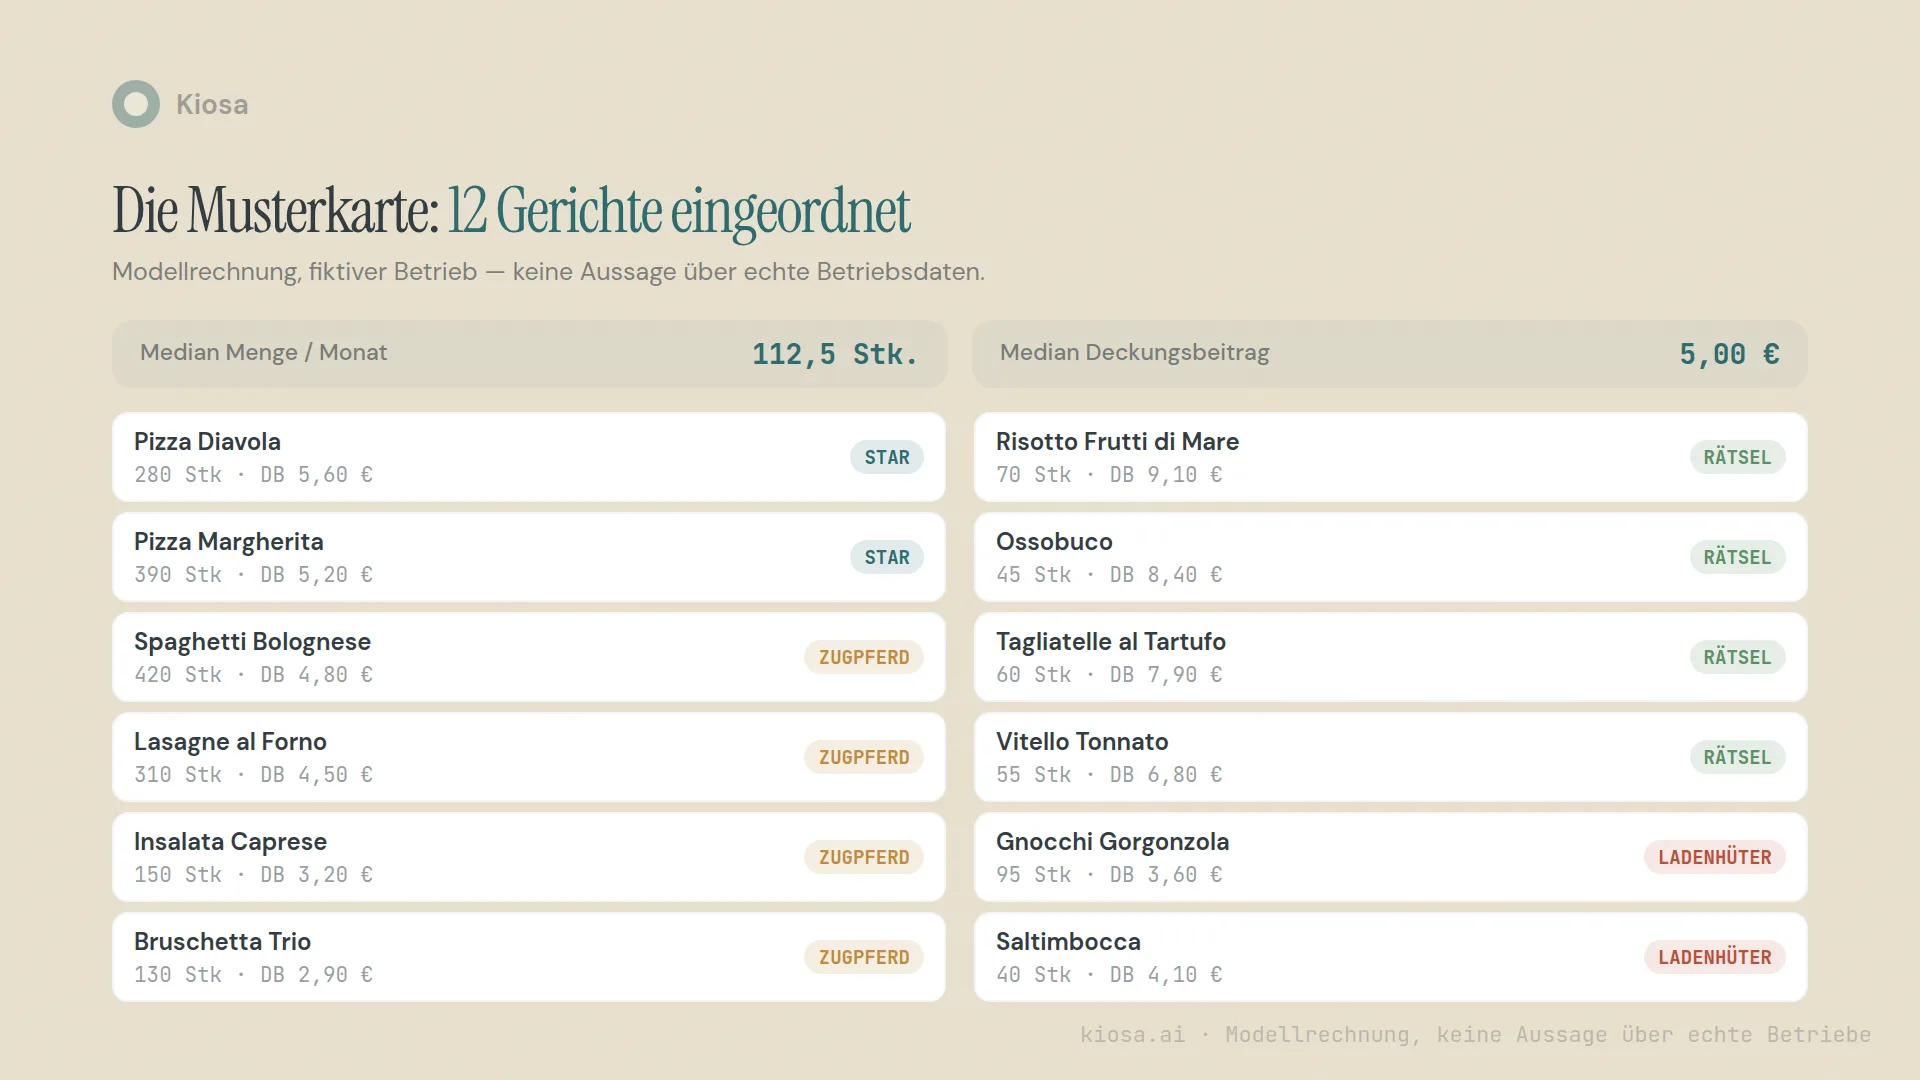
This sample menu shows something that repeats itself in real menus almost every time: the best-selling dish isn't a Star. Spaghetti bolognese, with 420 portions a month, sits below the contribution margin threshold at €4.80; it's a Plowhorse. The reverse holds for the dish with the highest contribution margin: risotto ai frutti di mare brings €9.10 per portion, but hardly gets ordered. That Puzzle is where the unused margin lies, not in the best-sellers. Finally, gnocchi gorgonzola and saltimbocca sit at the bottom on both dimensions. The menu carries them without them contributing anything.
What do you do with the Dogs?
Cutting Dogs straight off the menu is the obvious reflex, but not always the right first step. Before you cut, it's worth asking why a dish sits at the bottom.
Reposition before you cut. The gnocchi gorgonzola in the sample menu sells 95 times a month with a mediocre contribution margin. Is it right at the bottom of the menu, easy to miss, with no description beyond "gnocchi, gorgonzola sauce"? Then first test a better position and a text that sells, before you question the recipe entirely.
Check recipe, portion and price. If a dish still brings in too little despite a good position, the costing is usually the problem, not the popularity. Reduce or replace an expensive ingredient, adjust the portion size, raise the price by a moderate amount: often a single one of these adjustments is enough to lift a dish above the contribution margin threshold.
Slim down the menu if none of that works. Saltimbocca, with 40 portions and €4.10 contribution margin, is a clear candidate for cutting after two or three months without improvement. Every Dog costs storage space, prep and attention that a better dish misses out on, and the shorter the menu, the faster the kitchen.
Two exceptions apply regardless of the result. Dishes with a strategic role, such as the vegan dish or the kids' dish, often decide whether the whole party comes at all, even if they're rarely ordered. And new dishes deserve two to three months before you judge them; a fresh item on the menu needs time to get noticed at all.
Menu item sales analysis vs. menu engineering: what's the difference?
The two terms are often used interchangeably, and that causes confusion. Here's the clean distinction as I use it in this article:
The menu item sales analysis is the calculation method: quantity times contribution margin, median as the threshold, four quadrants, one recommendation per quadrant. That's exactly what we worked through completely above, sample menu and all. It answers the question: which dish earns money, and which only earns work?
Menu engineering is broader. It takes the same 2x2 matrix as its foundation, but then goes beyond pure number analysis: price architecture and price thresholds, price anchors and signature positioning, upselling structure, choice overload, quality of descriptions and names. It answers the question: does the menu as a whole sell as well as it could, independent of the pure numbers?
In short: the sales analysis tells you which dish needs attention. Menu engineering tells you what to do with the whole menu once you know that. If you've already built the matrix from this article and next want to know how to build prices, placement and descriptions on top of it, the article on menu engineering in practice is the right next stop.
Once a year isn't enough: how to do it continuously
The classic sales analysis is an afternoon's spreadsheet exercise, per location, usually once a year for the menu revision or at most quarterly. The problem: the menu still changes between two analyses. Purchase prices fluctuate, seasonal produce changes, a dish suddenly gets shared on social media and sells twice as often as last month. The annual analysis only sees it when it's long over.
Kiosa connects to your POS (officially OktoPOS and Hypersoft) without replacing it, and pulls the quantity sold per dish automatically. Through recipe management in the Inventory module, the system also knows the food cost and therefore the contribution margin per dish, updated as soon as a purchase price changes. The two numbers that otherwise have to be gathered laboriously for the analysis are always up to date, so the classification into the four quadrants can be done continuously instead of once a year, not just at menu changes.
That doesn't replace the decision about what to do with a Dog. You still make that decision. But you make it on numbers that are right this week, not from a spreadsheet from last quarter.
From analysis to action
What this is about: working through a best-seller vs. slow-seller matrix step by step and handling slow sellers properly.
Put it into practice: Recipe costs per dish in Kiosa Inventory
More on Food cost and inventory
- Food Cost Percentage Formula: Calculation, Example, Calculator
- Menu Engineering: How to Analyse Your Menu Like a Controller
- Contribution Margin per Dish: Calculate CM1 and CM2
FAQ
How often should I do a menu item sales analysis?
At least once a quarter, aligned with the rhythm of your menu changes and seasonal produce. With strongly fluctuating purchase prices or frequent promotions, a shorter cycle is worth it, because otherwise the contribution margin of individual dishes shifts unnoticed. If the analysis runs automatically from your POS data, there's no reason to wait for a fixed date any more.
What's the difference between a menu item sales analysis and menu engineering?
The sales analysis is the calculation method: quantity times contribution margin in four quadrants. Menu engineering uses the same matrix, but then goes into price architecture, placement and descriptions, everything that goes beyond pure number analysis. Details are in the article on menu engineering.
Is the average good enough as a threshold instead of the median?
Mathematically yes, in substance not really. The average reacts sensitively to individual outliers: one dish with exceptionally high sales pulls it up and thereby pushes other dishes below the threshold, without anything changing about their actual position. The median, by contrast, reliably splits the menu into two equal halves.
Do I have to take Dogs off the menu straight away?
Not straight away and not automatically. Before you cut, look at position, description and costing; often the problem isn't the dish itself, but how it's presented or priced. Two exceptions remain: dishes with a strategic role, like the vegan or kids' dish, and new dishes that haven't had a fair chance of two to three months yet.
How do I calculate contribution margin per dish?
Selling price minus food cost according to the recipe. Food cost includes every ingredient at its current purchase price, including sides, sauces, spices and a realistic allowance for waste and trim loss. The food cost calculator walks you step by step through the calculation for a single dish.
Your next steps
Food cost calculator: the foundation of every menu item sales analysis. Calculate contribution margin per dish with current purchase prices.
Menu price calculator: calculate a dish's net and gross price from ingredient cost, target percentage or contribution margin.
30 minutes well spent. You want to see sales mix and contribution margins continuously from your POS data, instead of gathering them in a spreadsheet every quarter? Book a demo call and I'll show you what that looks like with real data.
Related terms
- Contribution margin: selling price minus food cost, the second axis of the matrix
- Menu engineering: the broader discipline that includes price architecture and placement
