When a supplier raises prices, the percentage in the announcement is secondary. What matters is what the increase does to recipe cost, food cost percentage and menu price, added up over a full year. This article walks through a worked example, the annual impact across several locations and a decision aid: pass it on, adjust the recipe or absorb it. As a starting point you need your current food cost percentage; how to work it out from stock and purchases is in how to calculate food cost percentage.
Contents
- Why a supplier price increase isn't automatically a menu price increase
- How do you work a price increase through to the menu price?
- What does a 12 percent increase on pasta flour mean for one dish?
- How big is the annual impact for one location, and for several?
- Is your supplier's price increase justified at all?
- Pass it on, adjust the recipe or absorb it: how to decide
- How Kiosa spots a price increase before it shows up in your P&L
- FAQ
- Your next steps
Why a supplier price increase isn't automatically a menu price increase
The email is short: "From 1 December, our prices will rise by 12%." The first reaction is almost always emotional: annoyance, understanding, resignation, depending on the day. None of these reactions matter to the business. What matters is a number that isn't in the email: what does this increase do to the contribution margin of a single dish, and what does it do to the bottom line at year end?
That's a different topic from "silent" price increases, where a supplier shrinks pack sizes or introduces new surcharges without telling you. How to track down hidden adjustments like that is covered in the article on restaurant supplier price increases. This one is about the case that's out in the open: the increase has been announced and the percentage is fixed. The question isn't whether it exists, but what you do with it in your numbers.
The most common mistake I see in multi-location businesses: the supplier's percentage is carried straight over into the response. "Prices are going up 12%, so we have to raise the menu by 12%." That's almost always wrong, in both directions. Sometimes the actual effect on a dish is much smaller, because the affected ingredient is only part of the recipe. Sometimes it's bigger, because the same ingredient is in ten dishes on the menu and the individual amounts add up. Without working it through, you're deciding on a hunch.
How do you work a price increase through to the menu price?
The calculation has four stages. Each one can be checked, none needs software, just the discipline to actually do it instead of stopping at the supplier's percentage.
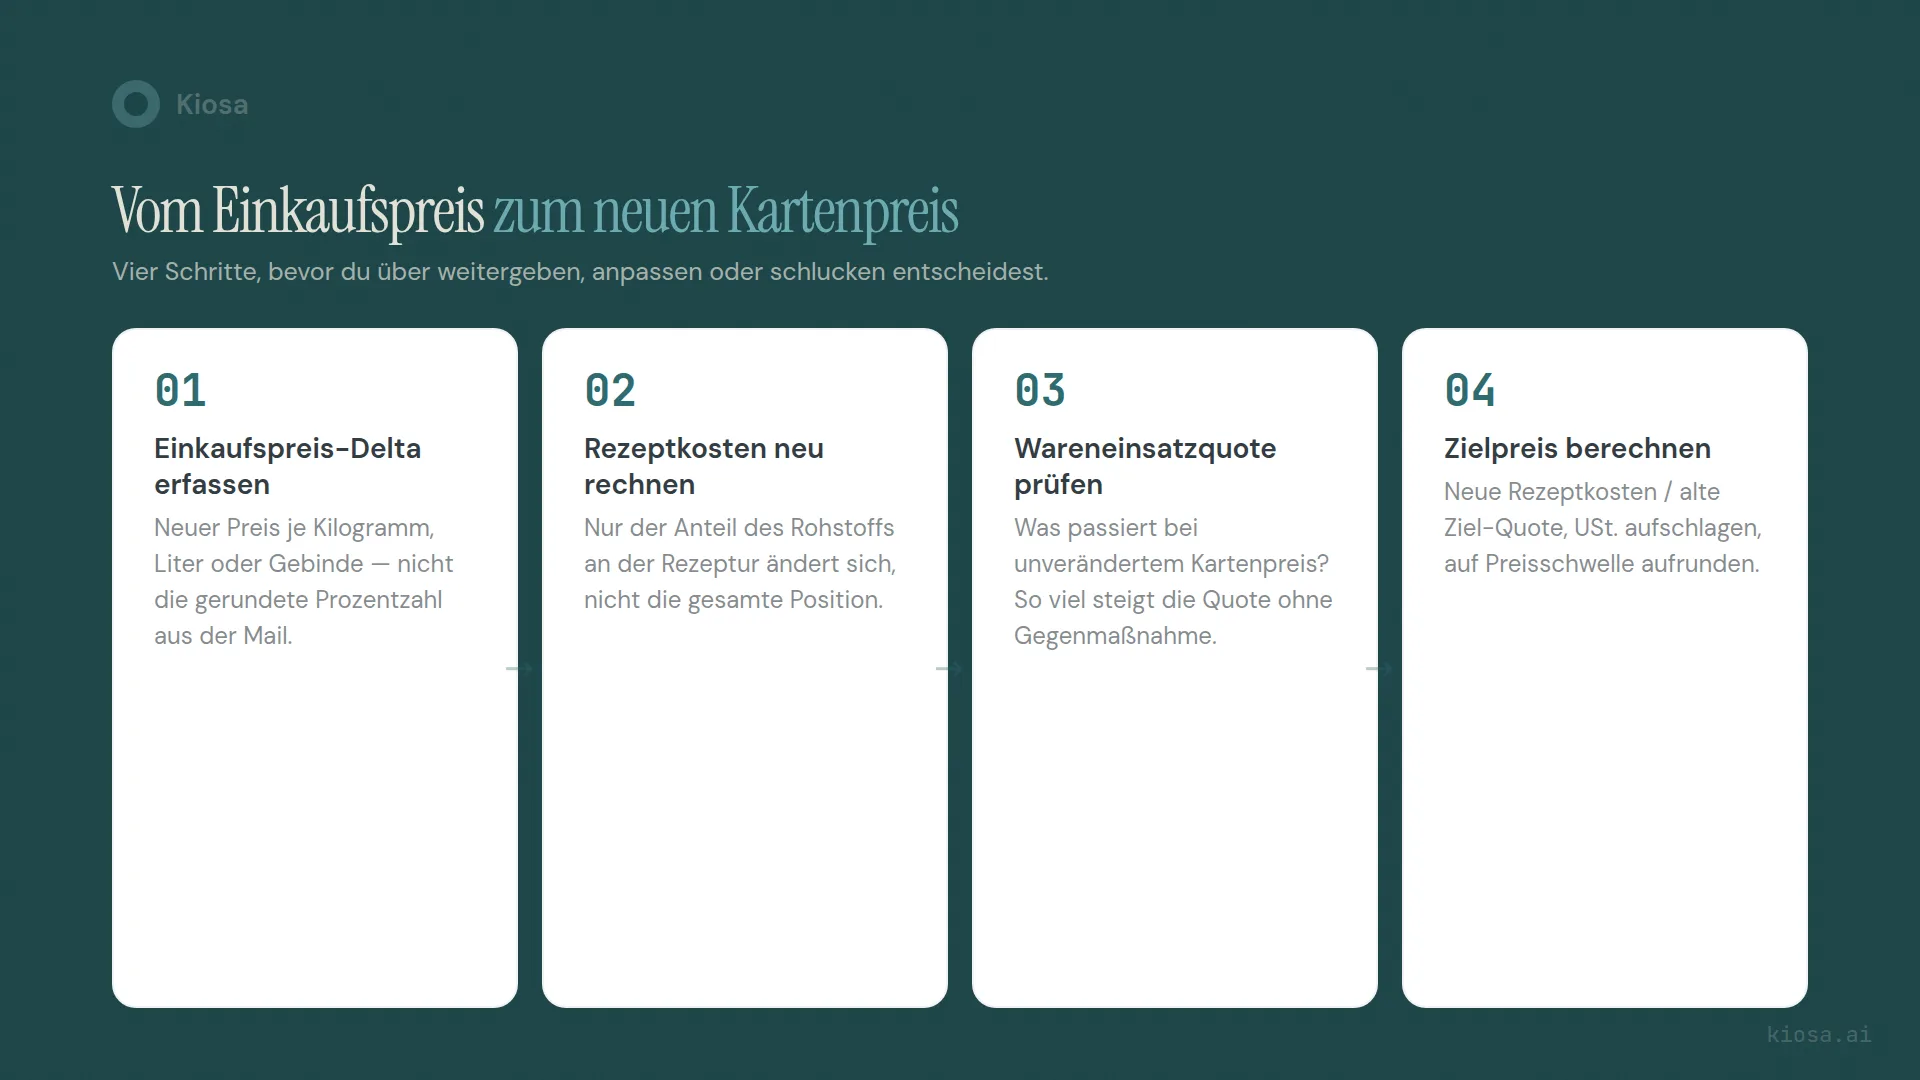
Step 1: capture the purchase price delta exactly. Don't take the percentage from the email; take the concrete new price per kilogram, litre or pack. Suppliers like to round their announcement to a neat number; the actual increase per item can differ.
Step 2: recalculate recipe cost for each affected dish. Only the ingredient's share of the recipe changes, not the whole item. An ingredient that makes up 15% of a dish's cost raises that dish's cost by about 1.8 percent with a 12% increase, not by 12.
Step 3: check the dish's food cost percentage against the unchanged menu price. What happens if you change nothing? The food cost percentage rises by exactly the amount the new recipe cost accounts for. That's your starting point for the decision.
Step 4: calculate the new menu price at your target percentage. Mathematically: new recipe cost divided by the old target percentage, then add VAT or sales tax at the rate that applies to you, and round to a sensible price threshold. Round up, not down, or you give away exactly the part of the increase you've just calculated.
These four steps apply to every dish that contains the more expensive ingredient. If it's in six items on the menu, you calculate six times, or you let your costing update automatically.
What does a 12 percent increase on pasta flour mean for one dish?
A worked example with a fictional restaurant, Ristorante Lago (two locations, Italian casual dining, annual net sales of €1.2 million per location). All figures are model values to illustrate the calculation, not a statement about real business data.
The dry goods supplier announces: durum wheat semolina for the homemade pasta will be 12% more expensive, from €1.10 to €1.232/kg, citing higher grain prices. One of the affected dishes is the tagliatelle ai funghi.
| Component | Quantity | Cost before | Cost after |
|---|---|---|---|
| Pasta (durum semolina, egg, homemade) | 130 g | €0.50 | €0.51 |
| Mushroom sauce (porcini, button mushrooms, cream, white wine) | 150 g | €1.86 | €1.86 |
| Parmesan | 15 g | €0.35 | €0.35 |
| Olive oil, herbs, spices | — | €0.13 | €0.13 |
| Waste and trim allowance (7%) | — | €0.20 | €0.20 |
| Total food cost | €3.04 | €3.05 |
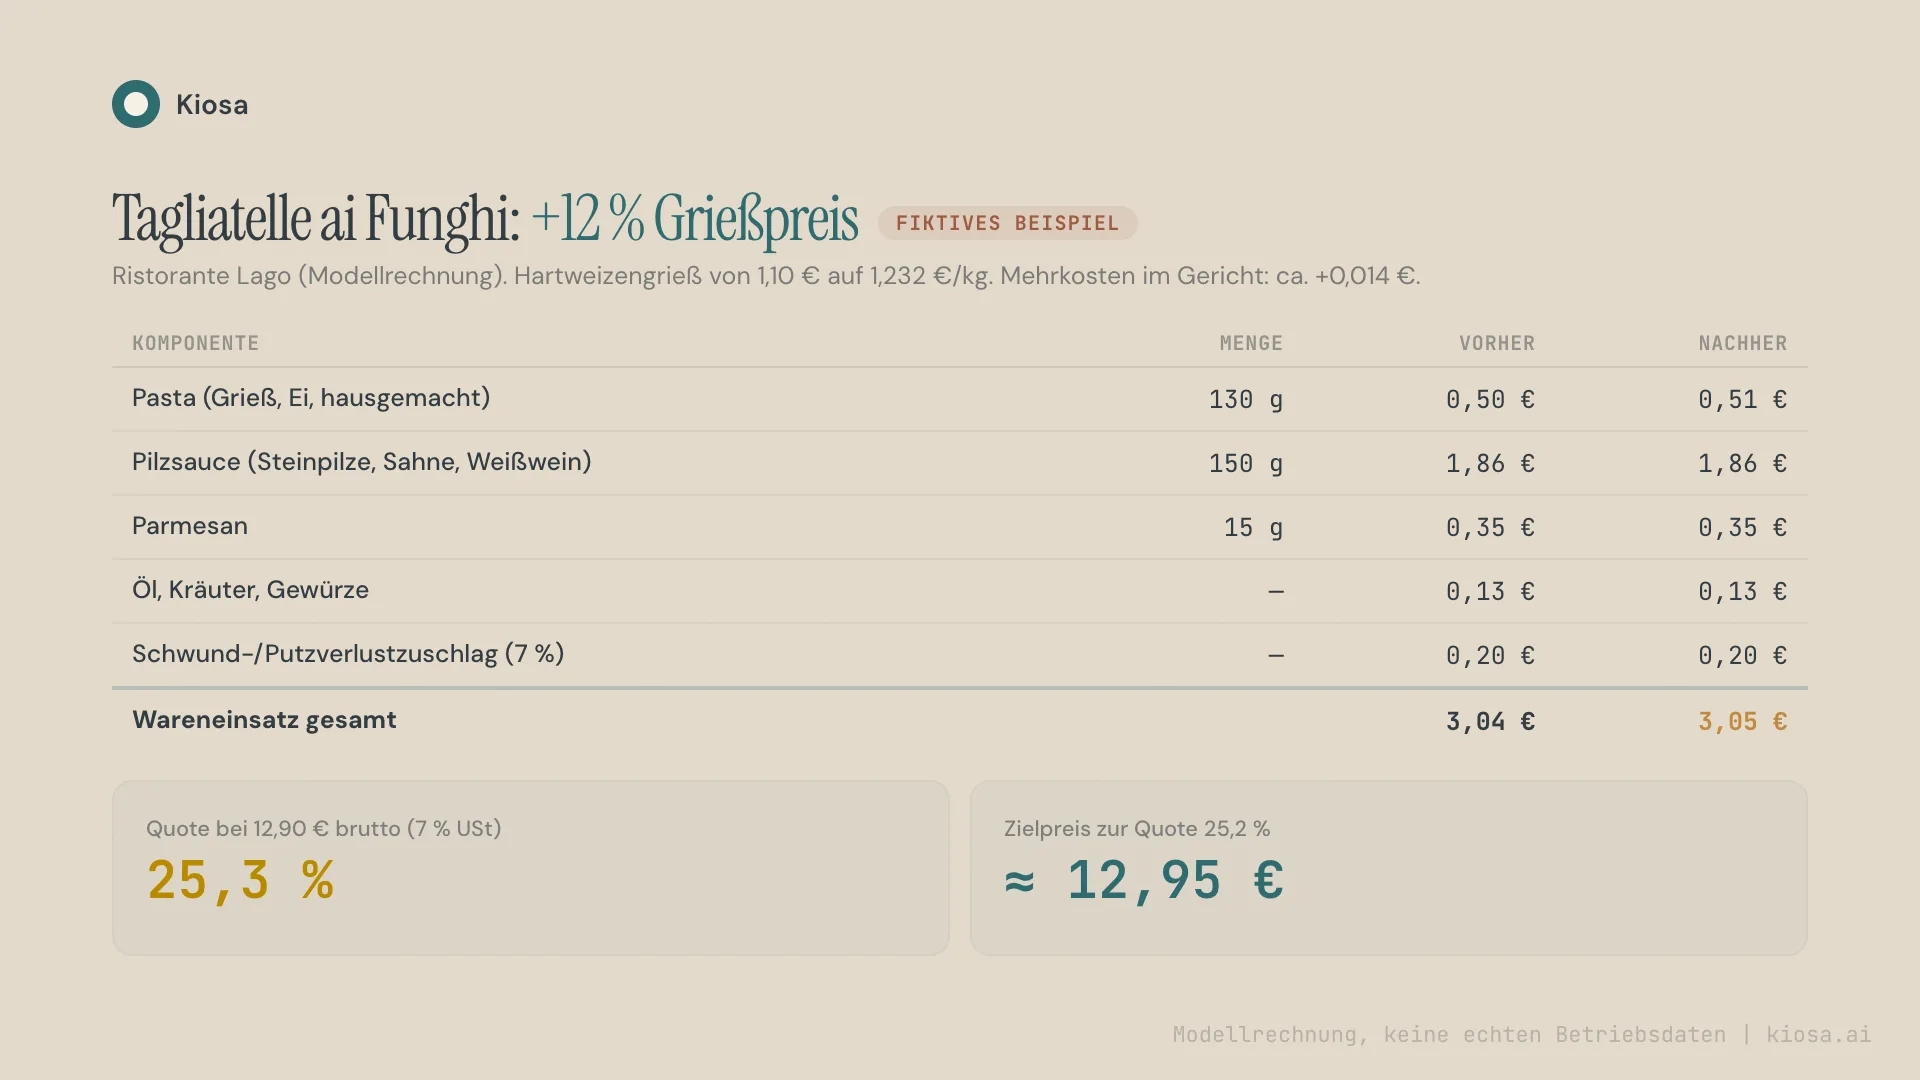
The semolina is only in the pasta component, which itself is only about 80% semolina; the rest is egg. So the 12% increase doesn't hit the dish at 12%, but at just over one cent per portion: around 104 g semolina × €0.132/kg ≈ €0.014. A double-digit percentage at the supplier almost always gets smaller in the dish before it gets bigger.
The current menu price is €12.90 gross, €12.06 net (this example uses a 7% VAT rate on food). The current food cost percentage: €3.04 / €12.06 = 25.2%. If the price stays the same, the percentage rises to €3.05 / €12.06 = 25.3%. A tenth of a point that barely registers on this one dish, but it's the first building block for the annual calculation in the next section.
To hold the target of 25.2%, the net price would have to rise to €3.05 / 0.252 = €12.10, roughly €12.95 gross. For just over a cent of extra cost, a separate price change for this one dish isn't worth it. If a price round is coming anyway, round up to a price threshold that doesn't feel arbitrary to guests, for example €13.20. That gives a food cost percentage of 24.7%, a buffer for the next price round.
How big is the annual impact for one location, and for several?
A delta of just over a cent per portion looks like nothing. The annual calculation shows why someone should still look at it, and why not every increase is equally dramatic.
Ristorante Lago uses around 4,800 kg of durum semolina per location per year for its homemade pasta line. With a price difference of €0.132/kg (€1.232 minus €1.10), that gives:
4,800 kg × €0.132/kg = €633.60 extra cost per location per year
Across both Ristorante Lago locations: €1,267.20 a year. Measured against annual net sales of €1.2 million per location, that's 0.053%, a number that rarely justifies a price round on its own.
What's often overlooked: suppliers rarely raise just one item. If the meat, fish and dairy suppliers also put prices up in the same quarter, several of these amounts per location add up to a sum that noticeably shifts the contribution margin of the whole menu. Looking at each supplier in isolation downplays the overall picture. That's why every increase belongs on a running list, not in a one-off decision. Only the total over a quarter shows whether a moderate adjustment is enough or a bigger price round is needed.
Always convert amounts to a yearly figure, not weekly or monthly. An extra cost per week looks negligible; the same number times 52 or times 12 gets the attention a decision needs, whether the decision ends up as "adjust" or a deliberate "absorb".
Is your supplier's price increase justified at all?
Before you work an increase through, it pays to look at the commodity markets. Not every justification stands up to the numbers, and some are even more convincing than the suppliers themselves put it.
Germany's Federal Statistical Office publishes producer and wholesale prices by product group on an ongoing basis. The picture in autumn 2026 is anything but uniform:
| Commodity group | Wholesale prices Sept. 2026 vs. Sept. 2025 | Producer prices Aug. 2026 vs. Aug. 2025 |
|---|---|---|
| Grain, raw tobacco, seeds, animal feed | +19.3% | Grain (agriculture) +11.5% |
| Vegetables | — | +14.3% |
| Table potatoes | — | +61.5% |
| Meat and meat products | −6.0% | Cattle −12.9% · Slaughter pigs −19.0% |
| Milk, dairy products, eggs, edible oils | −9.7% | Milk −23.9% · Eggs +7.9% |
| Fruit | — | −20.4% |
Sources: Destatis, wholesale prices September 2026 (accessed 9 November 2026), Destatis, producer prices of agricultural products August 2026 (accessed 9 November 2026).
Two things stand out. First: a supplier who justifies an increase on grain, flour or dry goods with "higher commodity costs" genuinely had the market behind them in autumn 2026; grain and feed were up by double digits year on year. Second: a meat or dairy supplier who writes the same justification in the same email did not. Cattle, pigs and milk became significantly cheaper over the same period in some cases, not more expensive.
That doesn't mean every meat or dairy price increase is unfounded. Regional suppliers, quality tiers and individual contracts can differ from national statistics. It means: producer and wholesale data are the yardstick you measure your supplier's justification against before you go into the price conversation. "Your prices are going up 8%, but producer prices for milk fell by almost 24% over the same period. How do we meet in the middle?" is a different conversation from one without numbers.
Pass it on, adjust the recipe or absorb it: how to decide
Three options, one decision. Two questions determine which one is right: how big is the ingredient's share of annual purchasing, and how easily can it be replaced or reduced?
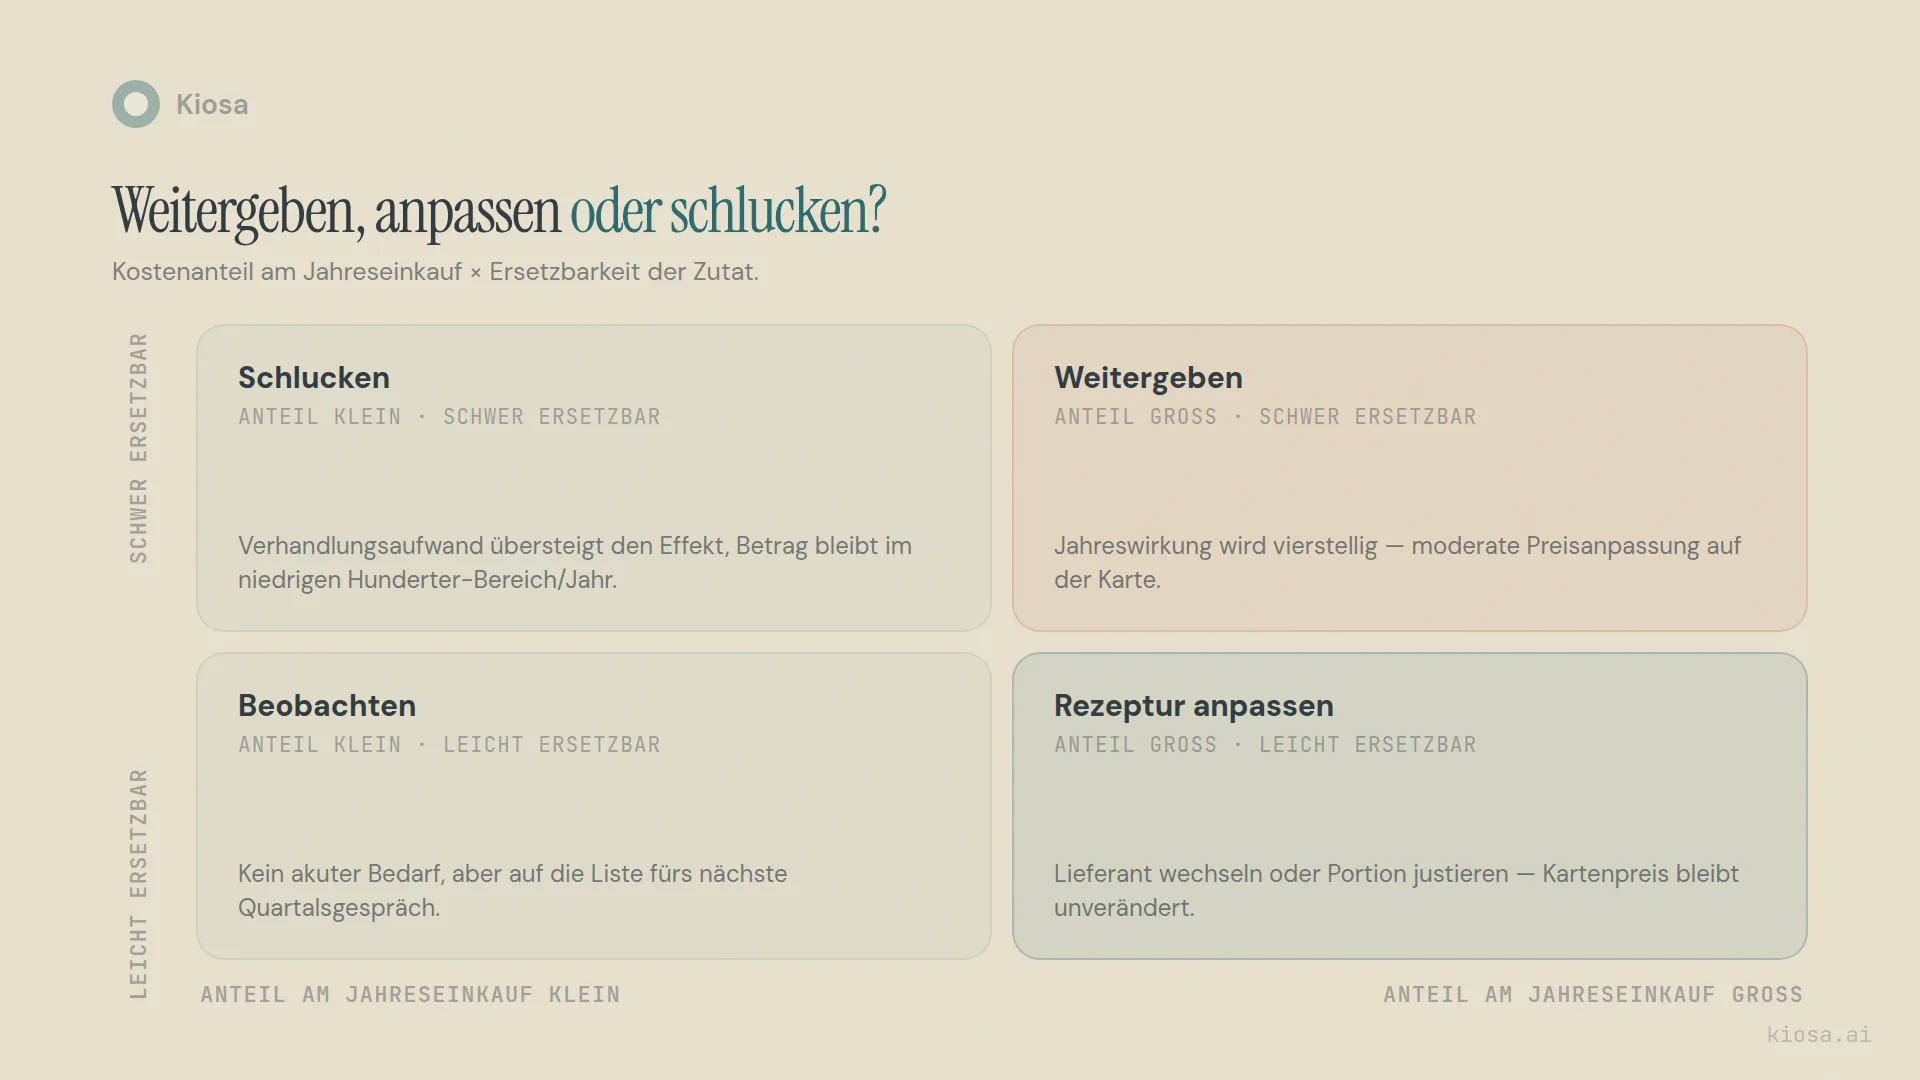
Small cost share, hard to replace → absorb. A speciality spice, an organic certification, a provenance claim on the menu: if the amount stays at a few hundred euros a year and the alternative would devalue the dish, it isn't worth the negotiating effort. That was exactly our pasta flour example: €633.60 per location per year, for an ingredient that defines the concept.
Small cost share, easy to replace → monitor. No immediate action needed, but it goes on the list for the next quarterly review. If several small increases pile up at the same supplier, the field tips.
Large cost share, easy to replace → adjust the recipe or the supplier. This is where the effort pays off: get a second source, adjust the portion size slightly, swap the ingredient for an equivalent alternative. That doesn't change the menu price at all; it just brings food cost back to its old level.
Large cost share, hard to replace → pass it on. If the ingredient makes up a double-digit percentage of the recipe, can't be swapped without a loss of quality, and the annual impact across all affected dishes runs to four figures, a moderate price adjustment on the menu is the most honest option. More honest, at any rate, than a recipe that gets noticeably worse for the guest just to keep the percentage on paper.
The most expensive decision is none of the three. It's the one that never gets made. A price increase that's neither passed on nor offset by an adjustment is a silent margin cut, without the control a deliberate decision would give you.
How Kiosa spots a price increase before it shows up in your P&L
You can do the calculation above with a calculator and a recipe folder. With a menu of 60 items and several suppliers per quarter, it quickly turns into drudgery, and that's exactly where it's decided whether a price increase is caught early or only weeks later in the monthly P&L.
In Kiosa's Inventory module, purchase prices come from your supplier invoices, and the comparison of theoretical and actual food cost runs with every stock count, with no reconciliation in spreadsheets after the fact. The purchase price watcher tracks every purchase price over time and alerts you when an item gets noticeably more expensive, before the increase quietly spreads through several recipes. Because recipe costs are linked directly to purchase prices in recipe management, dish costing updates automatically as soon as a price changes. The groundwork from steps 2 and 3 above, recipe cost and food cost percentage per dish, is then in place without you recalculating it by hand.
What Kiosa doesn't take off your hands: the decision from the previous section. Whether you pass it on, adjust or absorb remains a business decision; the system supplies the numbers continuously instead of at month end.
The Inventory module costs €49 per location per month, as an add-on to Kiosa One View (€99/location/month), with no setup fee. That works out at €588 a year per location. A single overlooked price increase in the four-figure annual range, for example when several ingredients rise at the same time, already costs more than the module.
From analysis to action
What this is about: working a supplier price increase through to the menu price and the annual impact.
Put it into practice: Purchase price watcher in Kiosa Inventory
More on Food cost and inventory
- Food Cost Percentage Formula: Calculation, Example, Calculator
- Restaurant Supplier Price Increases: How to Spot the Silent Ones
- Restaurant Menu Pricing: From Food Cost to Selling Price
FAQ
What do I do when my supplier raises prices?
First work out the concrete effect, not the percentage from the announcement: new recipe cost for each affected dish, new food cost percentage at an unchanged menu price, calculated target price at the old percentage. Only then do you decide between passing it on, adjusting the recipe or absorbing it, with numbers instead of gut feeling.
How do I calculate how much a price increase affects the menu price?
Work out the share of the more expensive ingredient in the dish's recipe cost, apply the increase only to that share, add up the new recipe cost and divide it by your target food cost percentage. The result is the new net price before rounding to a price threshold. The food cost calculator walks you through exactly this calculation.
Should I always pass a price increase on to guests?
No. For an ingredient with a small cost share, a price round often isn't worth it: the admin effort and the risk of annoying guests with a barely noticeable increase outweigh the effect. What matters is the share of annual purchasing and how replaceable the ingredient is, not the supplier's percentage alone.
How often should I update my costing after a price increase?
Immediately for every announced increase on a core item, plus at least twice a year as a routine re-costing of the whole menu. If you only recalculate once a year, you carry several small increases unnoticed for months. Details in the article on restaurant menu pricing.
How can I tell whether my supplier's price increase is justified?
Compare the justification with the official producer and wholesale prices for exactly that commodity group, for example from Germany's Federal Statistical Office or your own national statistics office. If producer prices for the affected product group fell over the same period instead of rising, that's a concrete starting point for a price conversation, with numbers instead of the feeling that "everything's getting more expensive right now".
Your next steps
Work the next announced price increase through properly. Don't take the percentage at face value; recalculate recipe cost for each affected dish. The food cost calculator does the arithmetic for you.
Check the justification against producer prices. Two minutes with your national statistics office, for example destatis.de, shows whether "higher commodity costs" holds for that product group right now or not.
Keep a running list of all announced increases per quarter. Individually, each increase looks small. Added up over a quarter and across all suppliers, the total decides whether you stay with "absorb" or need a price round. The P&L Analyzer shows how the total affects your overall result.
If you don't want to do this calculation by hand any more: in the Kiosa Inventory module, dish costing updates automatically as soon as a purchase price changes, including the purchase price watcher that alerts you to noticeable increases before they spread across the whole menu.
Book a free demo call: we'll look at your current costing and show you how much an announced price increase really costs you over the year.
Related articles: Restaurant supplier price increases · Restaurant menu pricing · Actual vs. theoretical food cost
