Silent supplier price increases cost a restaurant business with €1.5 million in net sales between €15,000 and €45,000 a year. The price per kilo goes up by 30 cents, the pack size shrinks from 10 to 8 kg, the small-order surcharge doubles. Individually, nothing stands out. Together, your food cost percentage rises by 1 to 3 percentage points — and nobody has queried a single invoice. You'd notice with ongoing control, as described in how to calculate food cost percentage and keep it under control.
AI can detect these patterns automatically. But even without software you can track down silent price increases if you know what to look for.
Table of contents
- Why silent price increases are so dangerous for restaurants
- The 5 most common supplier tricks
- What producer prices really do — and what reaches you
- How to build price monitoring that works
- Worked example: evaluating price monitoring properly
- When you should switch supplier — and when not
- FAQ
- Your next steps
Why silent price increases are so dangerous for restaurants
You spot open price increases immediately. Your supplier sends an email: "From 1 August our prices will rise by 3%." You do the maths, compare, decide. That's how purchasing works.
Silent price increases work differently. They come without announcement. One item gets 2% more expensive, but the price list has 400 lines. Another item keeps its price but delivers 800 g instead of 1 kg. A third gets a new "energy cost surcharge" — 1.8% on the value of the goods, hidden in the terms and conditions.
Why that's dangerous: because you only notice when your food cost percentage at month-end is 1.5 points higher than planned. And by then the trail has gone cold. Was it purchasing? Portioning? Shrinkage? Or did the supplier simply raise prices?
How big the effect is can only be calculated from your own invoices. To do so, set a price and pack-size baseline for each item and add up the actual deviations over a defined period. A blanket industry percentage would be misleading here.
The 5 most common supplier tricks
Not every supplier acts in bad faith. Many increases are commercially understandable. But as the buyer you still have to spot them.
1. Creeping price-per-kilo increases
The classic. The price per kilogram rises by 20 to 50 cents — on an item you order three to five times a week. Per delivery, it doesn't stand out. Over 12 months it adds up to four-figure amounts.
Illustrative example: if a 2.5 kg item rises from €11.20 to €12.30 per kilogram, the price history shows the change immediately. The annual amount depends on the quantity you actually buy and should be calculated from the invoice lines.
2. Shrinking pack sizes
What consumers know as shrinkflation happens more systematically in wholesale. The tin of tomatoes suddenly holds 2.5 kg instead of 2.65 kg. The block of butter weighs 10 kg instead of 10.5 kg. The unit price stays the same; the price per kilo rises by 6%.
A German consumer organisation, the Verbraucherzentrale, documents that the average hidden price increase through shrinkflation in German retail was 28.4% in 2025. In wholesale the adjustments are smaller, but more frequent.
3. New surcharges and fees
Energy cost surcharge, sustainability surcharge, express delivery fee, cold-chain fee: lines like these should be recorded separately from the value of the goods and compared over time. Only your own invoices show what they actually add up to.
4. Quality downgrade at the same price
The restaurant equivalent of skimpflation. The quality grade slips from "Extra" to "Class I". The meat has a higher fat content. The spice blend contains more filler. The price stays identical.
Hard to measure, easy to feel: the kitchen needs more product per portion because the quality has dropped. Food cost rises without any price on the invoice having changed.
5. Eroding terms
Your contract says: 3% early payment discount for payment within 10 days. With the next price list it becomes: 2% discount, 7 days. Or the volume discount only applies from €500 instead of €300 order value. Each change sounds trivial. Together they cost you 0.5 to 1% of your purchasing volume.
What producer prices really do — and what reaches you
An argument suppliers like to make: "Raw material prices have gone up." Sometimes that's true. Sometimes it no longer is.
For Germany, the Federal Statistical Office provides the facts: producer prices for agricultural products in December 2025 were 8.3% below the previous year. In May 2026, producer prices for industrial products overall were 2.2% above the previous year — after two years of decline. Food specifically fell by 3.6%.
The gap is widening. Between what your supplier pays on the purchasing market and what's on your invoice. Not for every item. But on average.
| Period | Producer prices, food (Germany) | Restaurant wholesale prices (estimated) | Your invoice |
|---|---|---|---|
| 2022–2023 | +18 to +25% | +15 to +20% | +12 to +18% |
| 2024 | −3 to −5% | −1 to −3% | ±0 to +2% |
| 2025 | −5 to −8% | −2 to −4% | ±0 to +3% |
| H1 2026 | −3.6% (May vs. prev. year) | −1 to −2% | ±0 to +2% |
Sources: Destatis producer price index, Destatis consumer price index for food. The non-official wholesale values in this example are explicitly estimates and must be checked against your own invoice data.
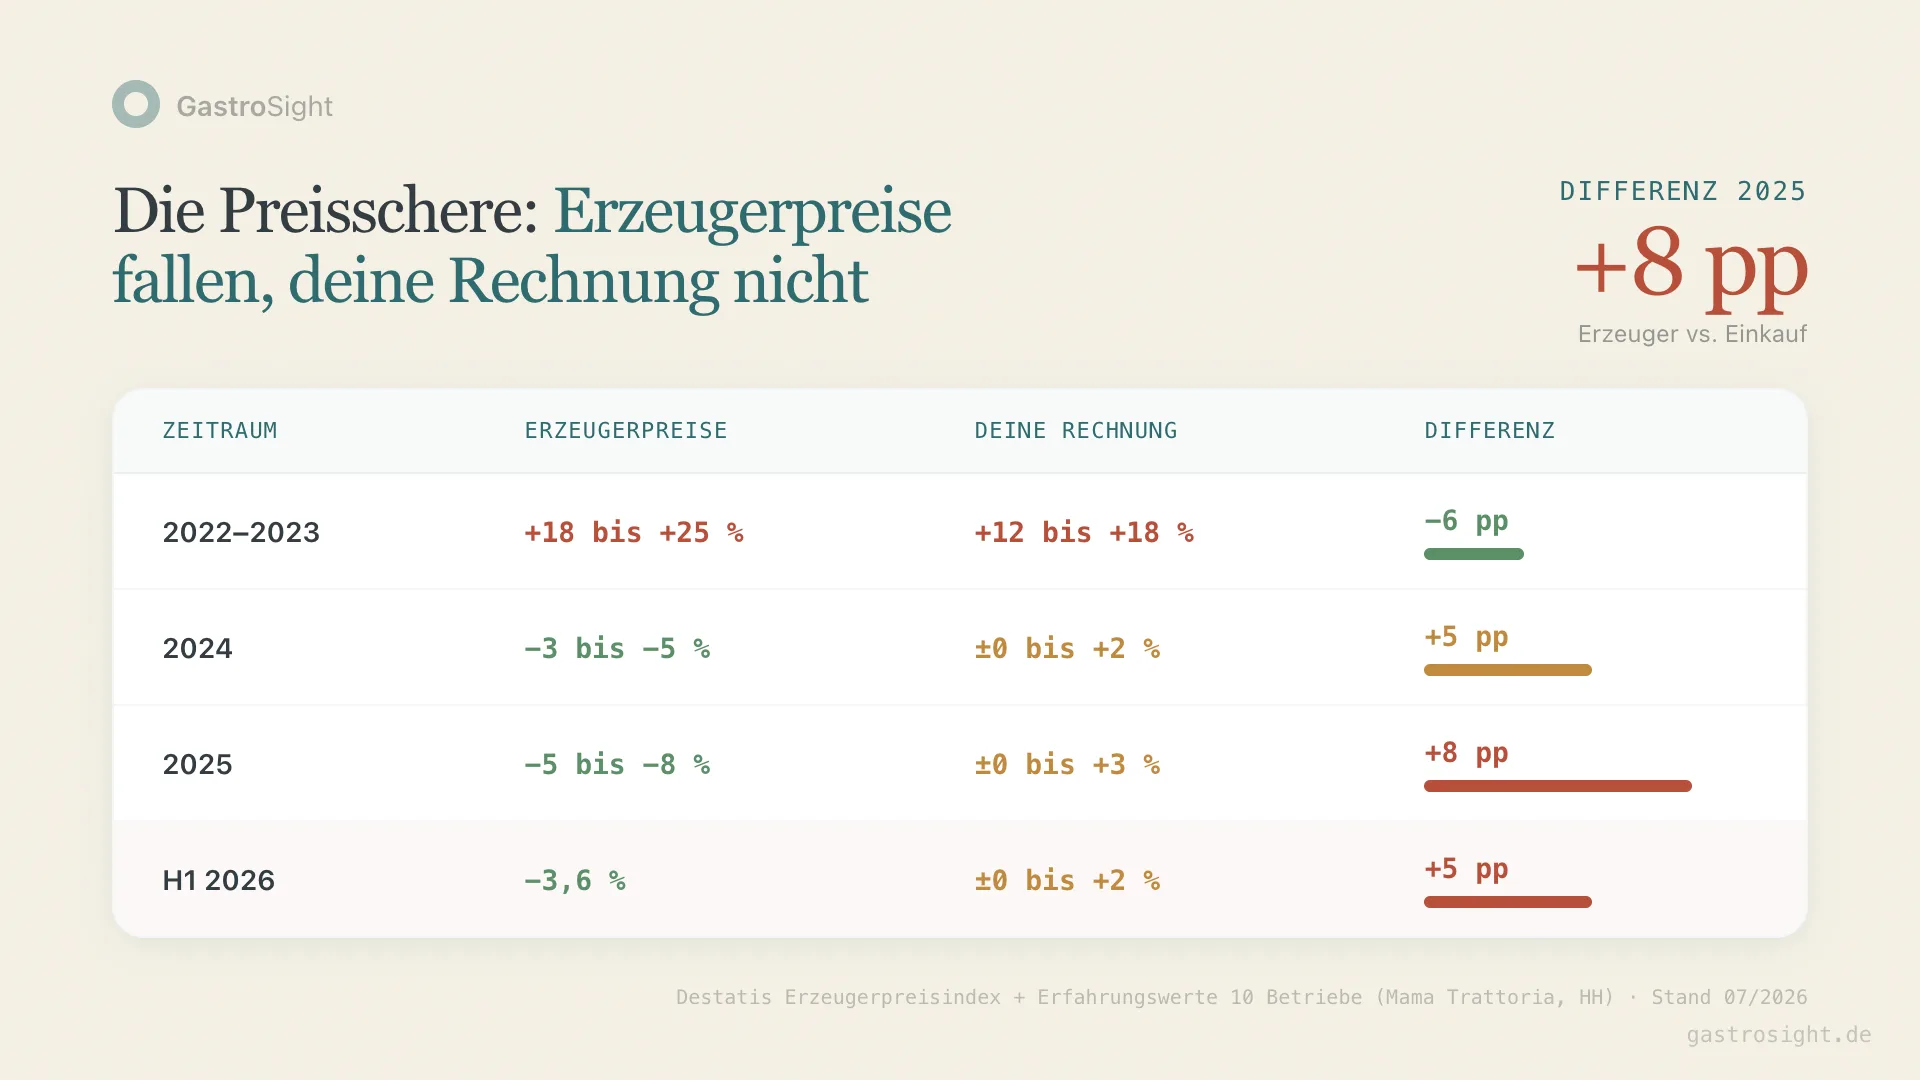
The "Your invoice" column is the point. Between 2022 and 2023 the increase was understandable — producer prices exploded. Since mid-2024 producer prices have been falling, but your purchase prices stay high. The technical term for this: asymmetric price transmission. Prices rise fast and fall slowly.
How to build price monitoring that works
You don't need a €500-a-month inventory system to spot price increases. You need a system.
Step 1: Identify your core items
80% of your food cost sits in 20% of your items. Identify your top 30 items by purchasing volume. In a full-service Italian restaurant, these are typically: flour, olive oil, buffalo mozzarella, tinned tomatoes, pasta, beef, fish, cream, wine (cooking and house), coffee.
Step 2: Document a price baseline
For each core item, record:
- Price per kilo (not unit price, not pack price)
- Pack size (exact weight in grams)
- Supplier
- Date of the last price change
- Discount and payment terms
All in one table. Or in the food cost calculator, which converts to price per kilo automatically.
Step 3: Weekly invoice check
Once a week: check delivery notes against orders. Not the invoice total, but the price per kilo for each item. You check three things:
- Has the price per kilo changed?
- Has the pack size changed?
- Are there new lines (surcharges, fees)?
Time needed: 20 minutes per supplier. With 3 suppliers: one hour a week. That's less than the time you lose staring at an unexplained food cost percentage at month-end.
Step 4: Automatic anomaly detection
A digital system can automate the check: scan the delivery note, extract the price per kilo, compare it with the baseline, report the deviation.
Kiosa does exactly that in the Inventory module. The system detects price changes when goods arrive and flags deviations above a configurable threshold. No manual Excel, nothing overlooked across 400 items.
The Inventory module costs €49 per location per month, with no setup fee. Whether it pays off follows from the improvements in terms you actually achieve minus licence and process costs — not from savings promised in advance.
Step 5: Quarterly negotiation with data
Once a quarter: sit down with each core supplier. Not with gut feeling, but with your price history. "Your prices per kilo for buffalo mozzarella have risen 9.8% since January. Producer prices for dairy fell 4% over the same period. How do we explain the difference?"
You negotiate differently with numbers than with feelings.
Worked example: evaluating price monitoring properly
The following example shows the calculation logic with fictitious values. It's not a customer result.
Assume a location with €2.1 million in net sales and food cost at 29.8%. Solid on paper.
When setting up price monitoring, items like these could stand out:
- Olive oil: price per kilo up 14% within 9 months (producer price: +6%). Switching supplier saves €3,200 a year.
- Buffalo mozzarella: pack shrunk from 2.5 kg to 2.35 kg at the same unit price. Switching to an alternative supplier saves €1,800 a year.
- Beef fillet: quality grade changed from "young" to standard. Renegotiation brought back the old quality at the old price.
- Surcharges: 3 suppliers together charged €4,100 a year in energy and logistics surcharges. 2 of them were negotiable; saving €2,400.
- Eroding payment terms: one supplier had shortened the early payment window from 14 to 7 days. Renegotiated to 10 days: €900 a year.
Savings in the first year: €5,000 from switching suppliers, €3,300 from renegotiating existing terms. Together: €8,300 — not counting the beef fillet quality issue.
That's around 0.4 percentage points of food cost — and directly more contribution margin per dish. In a business that already looked "good".
When you should switch supplier — and when not
Switching costs. New contacts, new ordering rhythms, new delivery times, new product codes in the system. Don't switch over 2% on a single item. Switch when:
Switching makes sense:
- The total deviation across all core items from this supplier is persistently more than 5% above market price.
- The supplier refuses price transparency or declines quarterly reviews.
- Quality problems pile up and aren't resolved.
- An alternative supplier offers at least 8% total savings at comparable quality and delivery reliability.
Switching is risky:
- You optimise only for price without checking delivery reliability. One missed delivery on a Friday evening costs you more than 12 months of price savings.
- You only have one alternative supplier. Without a second option you have no negotiating position.
- The supplier carries specialist items that are hard to replace (regional products, special cuts, organic certification).
The better first step is almost always: gather data, hold a quarterly review, negotiate transparently. Only switch if that fails.
From analysis to action
What this is about: purchase price history and spotting silent supplier increases.
Put it into practice: Purchase price watcher in Kiosa Inventory
More on Food cost and inventory
- Food Cost Percentage Formula: Calculation, Example, Calculator
- Restaurant Menu Price Increase: From Supplier Price to Menu Price
- Restaurant Inventory Management System: Cost and When It Pays Off
FAQ
How often should I compare supplier prices?
Core items (top 30 by purchasing volume): weekly, when checking delivery notes. All items: monthly, as a spot check of 10–15 random lines. A quarterly meeting with each core supplier, fixed in the calendar.
Is an inventory management system worth it for a single restaurant?
Yes, if your food cost is above €200,000 a year. A system like the Kiosa Inventory module (€49/month) pays for itself from savings of €588 a year. Most businesses find more than that in the first month.
Can a supplier change prices without notice?
That depends on your contract. Unless you have a fixed-price agreement for a defined term, price adjustments are often permitted; framework contracts with price adjustment clauses are common. Check your terms and contracts for wording such as "prices subject to change" or "prices on the day of delivery". With a fixed-price contract, the supplier has to honour the agreed prices.
What is a healthy food cost percentage?
There's no universally valid value; it depends on your concept and menu. The definition of the food cost ratio and how to calculate it are in the glossary or the food cost calculator. Use your own trend per location as the benchmark rather than a single target number.
How do I negotiate prices with suppliers without ruining the relationship?
Facts, not accusations. Show your price history, refer to producer prices, name the deviation precisely. Don't say "You're too expensive", say "Your prices have risen 9.8% while producer prices fell 4%. How do we get back together?" Most suppliers respect a customer who knows their numbers.
Your next steps
Three things you can do this week:
Create your top 30 list. Identify your 30 biggest purchasing items and document the current price per kilo. Use the food cost calculator for this.
Check the last 3 months of delivery notes. Compare the prices per kilo of your top 10 with where they stood 6 months ago. More than 5% higher without notice? A topic for your next supplier meeting.
Introduce a quarterly review. Once a quarter, 30 minutes per core supplier. With your price history and producer price statistics (for Germany, the Destatis producer price index) as a reference.
If you want to automate the process: the Kiosa Inventory module monitors prices as goods arrive, compares them against your baseline and reports deviations. Together with checking whether your menu prices still match your purchase prices, you have both sides of the margin in view.
Book a free demo call — we'll look at your purchasing data together and show you where the silent price increases are hiding.
Note: This article isn't legal advice. Have contract reviews of terms and price adjustment clauses done by a lawyer. As of July 2026.
Related articles: Food cost percentage formula · Restaurant prime cost · Restaurant menu pricing
