Six labor KPIs are enough to run your team on numbers: labor cost percentage, sales per labor hour, hours per 100 guests, staff turnover, sick leave rate and overtime rate. Each has a formula and a reference value with a source, and each shows a different risk, from costs that are too high to staff quietly slipping away.
Most restaurants know one of them well: labor cost percentage, because it's in the monthly P&L. The other five stay in the dark until a location suddenly has three resignations in one week or sick leave knocks out a shift. This article puts all six in context, with formula, sourced reference value and a worked example.
Contents
- Why 6 KPIs are enough to steer your staff
- Labor cost percentage: what your team really costs
- Sales per labor hour: what an hour has to bring in
- Hours per 100 guests: productivity without the wage rate
- Staff turnover: the industry's most expensive problem
- Sick leave rate: the early indicator for leadership
- Overtime rate: the cost that hides itself
- All 6 labor KPIs at a glance
- How Kiosa shows the 6 KPIs every day
- FAQ
- Your next steps
Why 6 KPIs are enough to steer your staff
Labor and cost of goods are the two biggest cost blocks in any restaurant's numbers. Even so, many operators run their team on gut feeling: enough people on the schedule, wage costs within limits, done. That works as long as nothing goes wrong.
Once something goes wrong, a single glance at labor cost percentage is no longer enough. A percentage in the green tells you nothing about whether your team is resigning one after another, whether half of them are off sick, or whether the people left have been absorbing overtime for weeks that nobody counts. That is exactly why a set of six KPIs beats a single one.
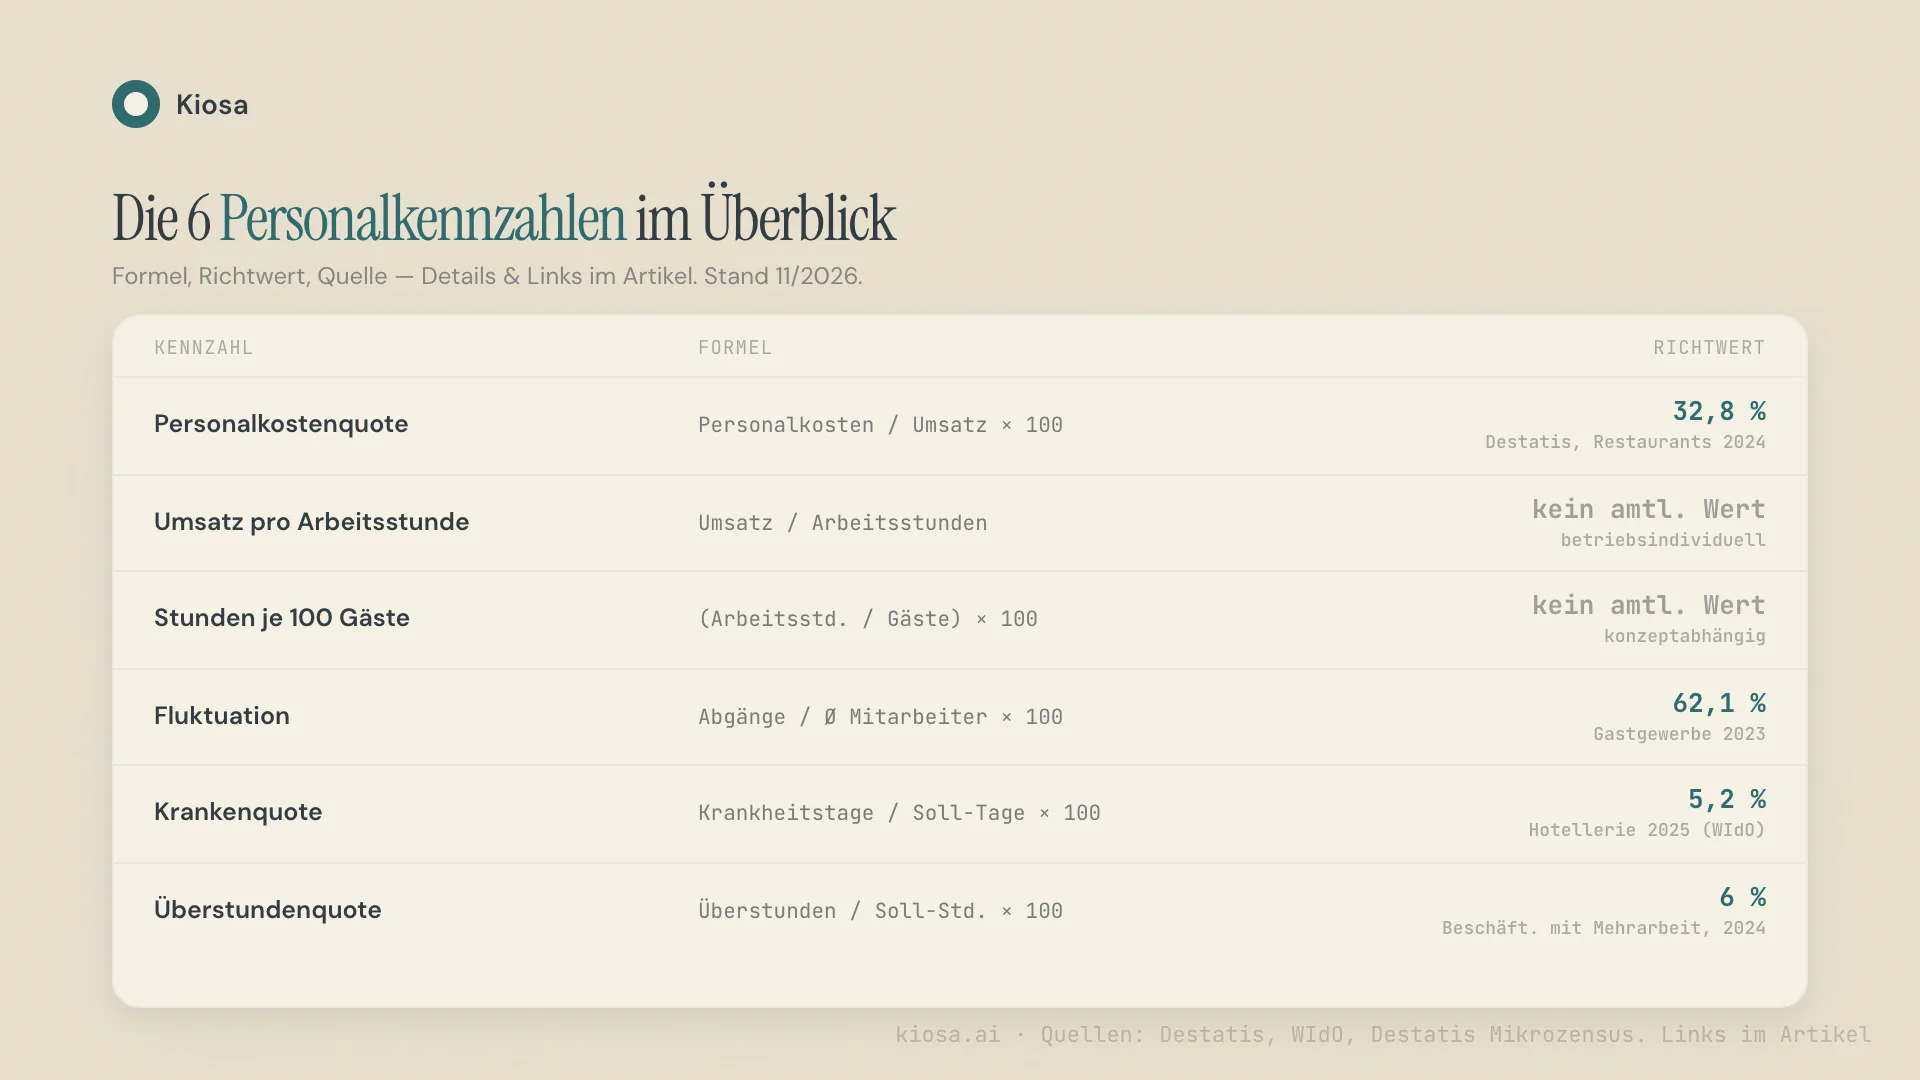
The six fall into two groups. Labor cost percentage, sales per labor hour and hours per 100 guests answer the question: is my team working profitably? Turnover, sick leave rate and overtime rate answer a different, often underrated question: can my team sustain this? The two groups are linked: high turnover eventually drives costs up too, just with a delay.
Labor cost percentage: what your team really costs
Labor cost percentage = total labor cost / net sales × 100
The best known of the six, and the one most often calculated wrongly, usually because only gross wages are counted instead of full labor cost (including employer contributions, insurance and premiums).
Reference value: According to Germany's Federal Statistical Office, personnel expenses in restaurants, bars, snack bars and cafés came to 32.8% of sales in 2024 (2019: 30.6%; Destatis, table 48112-0001, own calculation from personnel expenses and sales). What matters is your own trend per location and week.
This KPI deserves an article of its own: the calculation including all on-costs, benchmarks by concept type and five concrete levers are in the deep dive on restaurant labor cost percentage. The short version is enough here, because it's meant to be read as one of six KPIs, not in isolation.
Sales per labor hour: what an hour has to bring in
Sales per labor hour = net sales / labor hours worked
Labor cost percentage shows the cost share. Sales per labor hour (also called revenue per labor hour) shows the other side: how productively your team turns scheduled hours into sales. A restaurant can have an unremarkable labor cost percentage and still have too many hours on the schedule. If sales grow too, the percentage stays stable while actual productivity falls.
Reference value: This is where it gets honestly thin. There is no official reference value for sales per labor hour. The KPI depends heavily on concept, price point and depth of service, so it's mainly useful as an internal comparison across weeks and locations, not as an industry-wide figure. Guide values by concept type are in the glossary entry.
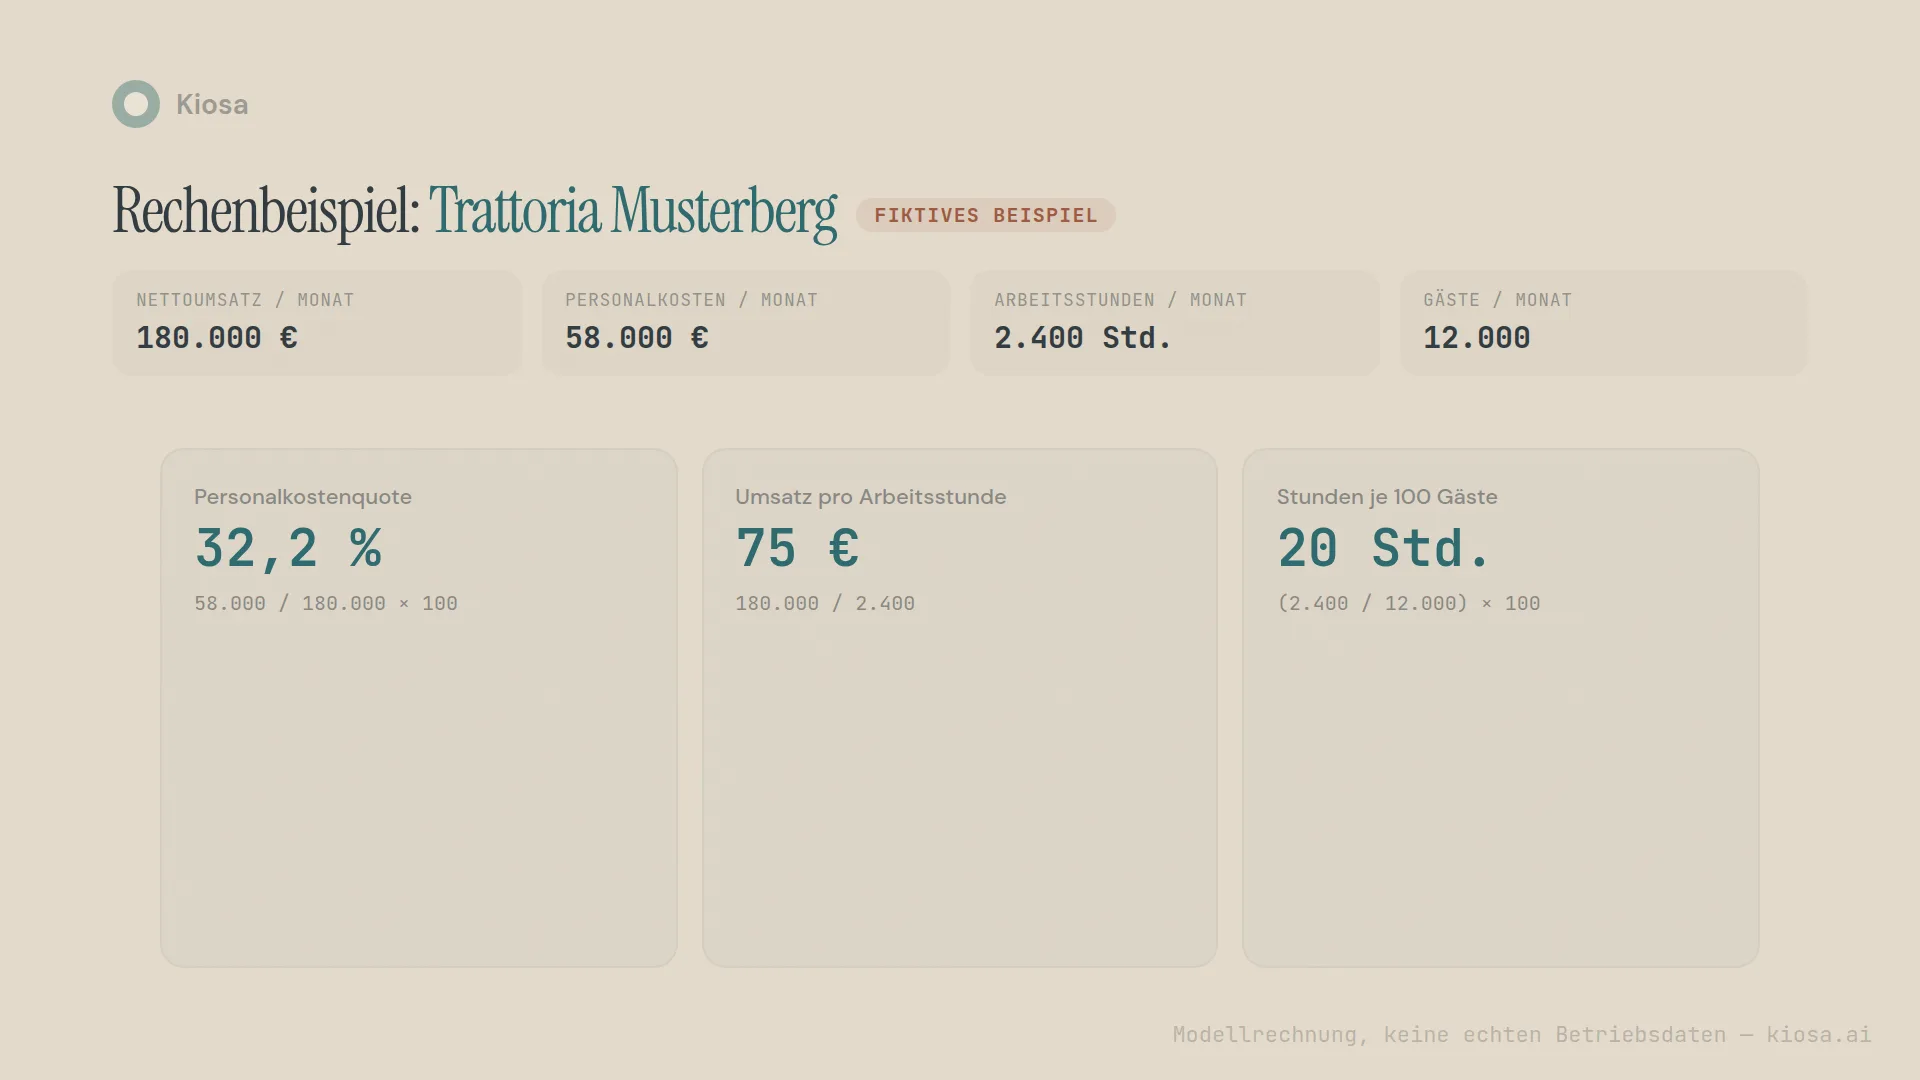
Worked example (fictional sample restaurant, Trattoria Musterberg): €180,000 net sales a month, 2,400 labor hours worked. 180,000 / 2,400 = €75 sales per labor hour. If a location stays below that level for weeks, either too many staff are scheduled or sales are falling short of plan. You can only spot either if you see the number continuously, not when the monthly P&L arrives. How to build this KPI into scheduling is covered in restaurant labor scheduling based on sales.
Hours per 100 guests: productivity without the wage rate
Hours per 100 guests = (scheduled labor hours / guest count) × 100
Sales per labor hour has a blind spot: if sales rise only through higher prices, not more guests, the KPI looks better without anything changing in the workload. Hours per 100 guests takes the wage rate out entirely and asks only: how much staff time does a fixed number of guests need?
Reference value: Again, there's no uniform industry statistic. The differences between self-service, classic full service and fine dining with a multi-course menu are too large. The KPI works best as your own reference: measure it for a few months, set the quietest and busiest weeks as a corridor and watch for deviations from there.
Worked example (fictional): 2,400 labor hours a month, 12,000 guests. (2,400 / 12,000) × 100 = 20 hours per 100 guests. If this value rises over several weeks without any change to the offer or service concept, productivity is falling, regardless of what sales and labor cost percentage show over the same period.
Staff turnover: the industry's most expensive problem
Turnover rate = leavers per year / average headcount × 100
Of all six KPIs, this is the one where hospitality stands furthest from the rest of the economy. Staff turnover measures how many employees a business loses per year relative to its average headcount.
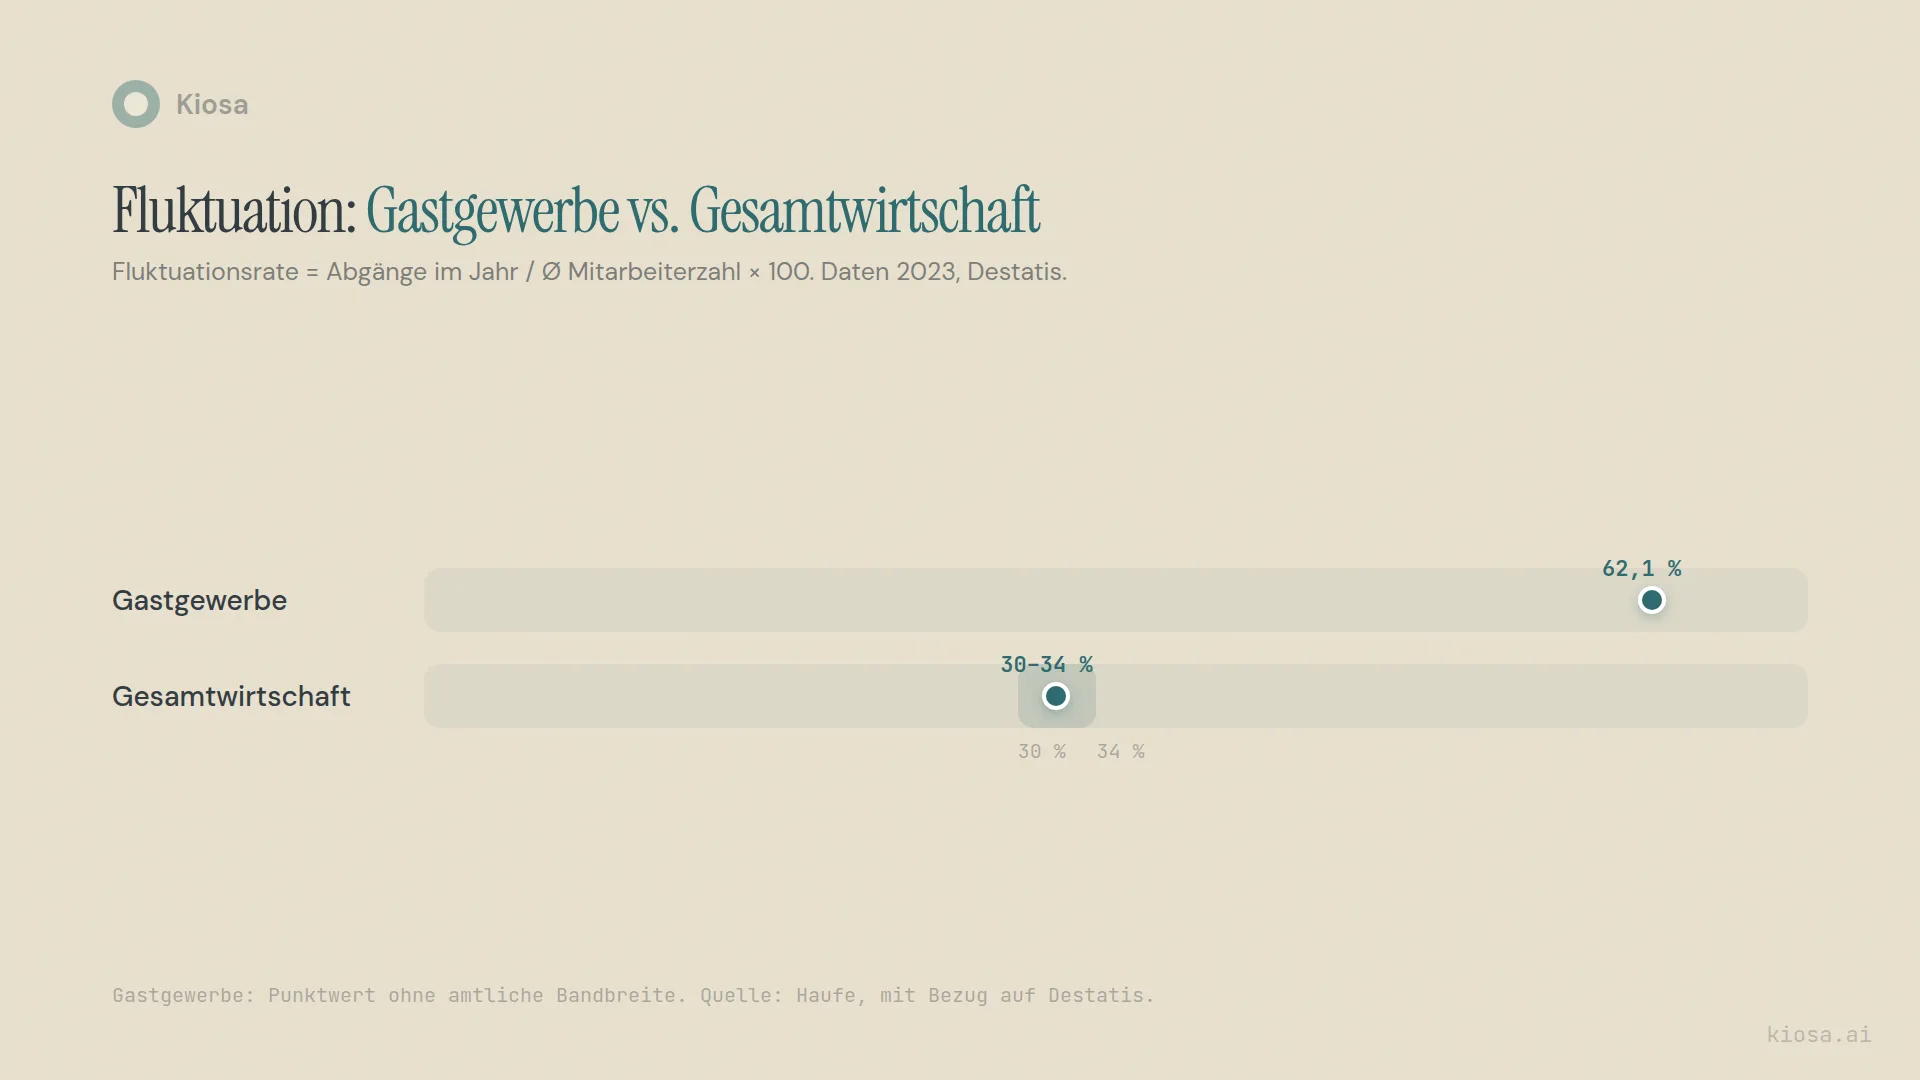
Reference value: According to data from Germany's Federal Statistical Office, the turnover rate in hospitality was 62.1% in 2023, almost twice the economy-wide average of 30 to 34%. Source: Haufe, citing Destatis, accessed 2 November 2026.
Worked example (fictional): A restaurant with an average of 20 employees records 9 leavers in a year. 9 / 20 × 100 = 45% turnover. That's well below the German hospitality average of 62.1%, but every single departure still costs money: recruiting, onboarding, lost productivity in the first weeks. Turnover is the only one of the six KPIs where hospitality genuinely does worse than practically every other industry. For sick leave and overtime, the picture turns around, as the next two sections show.
Sick leave rate: the early indicator for leadership
Sick leave rate = sick days / scheduled working days × 100
The sick leave rate often reacts to overload earlier than resignations do: people who constantly have to cover shifts get sick more often first, before they quit.
Reference value: According to an analysis by the research institute of the German health insurer AOK (WIdO), the sick leave rate in the German hotel sector was 5.2% in 2025. Source: hotelier.de, citing WIdO/AOK, accessed 2 November 2026.
Worked example (fictional): A restaurant with 20 employees and 220 scheduled working days per person per year comes to 4,400 scheduled working days in total. With 220 sick days in the year: 220 / 4,400 × 100 = 5% sick leave rate, close to the German hotel-sector average. The value on its own says little. Only the trend over several months shows whether a location is moving away from that level.
Overtime rate: the cost that hides itself
Overtime rate = overtime hours worked / contracted hours × 100
Overtime is the most expensive way to cover staff shortages in the short term, and the one least often tracked systematically. If you only pull it from time tracking at month end, you see the problem when it's already three or four weeks old.
Reference value: There's no official value for the overtime rate, but there is an official data point: according to the German microcensus, 6% of hospitality employees worked extra hours in 2024, the lowest share of any industry, lower than cleaning and other services (8%) and far below financial services (17%). Source: Federal Statistical Office (Destatis), accessed 2 November 2026.
At first glance that seems to contradict the industry's reputation. The explanation probably lies in how it's recorded: the microcensus asks people to self-report extra hours in a reference week, paid or unpaid. A study by the Pestel Institute commissioned by the NGG union arrived at 14.25 million overtime hours for German hospitality as a whole (2022), 5.55 million of them unpaid (accessed 2 November 2026). A very different view of the same industry, collected through union data rather than official statistics.
Worked example (fictional): 2,400 contracted hours a month, 96 of them overtime. 96 / 2,400 × 100 = 4% overtime rate. Whether a rate of this size is harmless or already a warning sign depends heavily on whether it's concentrated on a few people or spread widely. The bare percentage doesn't tell you that; a weekly look at time tracking does.
All 6 labor KPIs at a glance
| KPI | Formula | Reference value | Source |
|---|---|---|---|
| Labor cost percentage | Total labor cost / net sales × 100 | 32.8% personnel expenses in restaurants, bars, snack bars and cafés (Germany, 2024) | Destatis, table 48112-0001 |
| Sales per labor hour | Net sales / labor hours | No official value, business-specific | — |
| Hours per 100 guests | (Labor hours / guest count) × 100 | No official value, depends on concept | — |
| Turnover | Leavers / avg. headcount × 100 | 62.1% (hospitality, Germany, 2023) | Haufe/Destatis |
| Sick leave rate | Sick days / scheduled working days × 100 | 5.2% (hotel sector, Germany, 2025) | hotelier.de/WIdO-AOK |
| Overtime rate | Overtime / contracted hours × 100 | No official value; 6% of hospitality employees worked extra hours in 2024 (Germany) | Destatis |
The table shows: for sales per labor hour, hours per 100 guests and the overtime rate there's no official reference value; they are mainly useful as your own comparison across weeks and locations. For turnover, by contrast, there's a strikingly high industry value. If you only track labor cost percentage, you see none of it.
How Kiosa shows the 6 KPIs every day
Kiosa is a controlling dashboard that reads your POS (OktoPOS or Hypersoft) but doesn't replace it. From POS and labor data, Kiosa calculates labor cost percentage and sales per labor hour daily per location, not weeks later when the monthly P&L arrives.
The Scheduling module can be booked, and if you'd rather stay with gastromatic, e2n or ordio, Kiosa reads your data from there (see integrations). You don't have to pick a side.
You see overtime and sick days in Kiosa from time tracking and the schedule; turnover remains a matter for your HR team. Kiosa does not run payroll.
From analysis to action
What this is about: six labor KPIs with formula, reference value and context.
Put it into practice:
- Labor cost percentage and sales per labor hour in Kiosa One View
- Kiosa Scheduling with time tracking and absences
More on Labor costs and scheduling
- Restaurant Labor Cost Percentage: How to Calculate and Benchmark It
- Restaurant Prime Cost: The Most Important KPI Hardly Anyone Uses
- Restaurant Labor Scheduling Based on Sales: Hours Budget, RPLH and Plan vs. Actual
FAQ
Which 6 labor KPIs should a restaurant operator keep an eye on?
Labor cost percentage, sales per labor hour, hours per 100 guests, turnover, sick leave rate and overtime rate. The first three show profitability; the last three show whether your team can carry the load over time.
How often should I check labor KPIs?
Labor cost percentage, sales per labor hour and hours per 100 guests suit a weekly, ideally daily rhythm, because they come straight from sales and the schedule. Turnover, sick leave rate and overtime rate are fine monthly. They change more slowly, but shouldn't only surface in the annual review.
What is a good labor cost percentage for a restaurant?
According to Germany's Federal Statistical Office, personnel expenses in restaurants, bars, snack bars and cafés came to 32.8% of sales in 2024 (2019: 30.6%; Destatis, table 48112-0001, own calculation from personnel expenses and sales). What matters is your own trend per location and week. The full calculation including all on-costs is in the deep dive on labor cost percentage.
Why is staff turnover in hospitality so high?
Because the industry offers many entry points without formal training and demand for staff fluctuates strongly with the seasons; both encourage frequent job changes. At 62.1% (Destatis, 2023), the turnover rate in German hospitality is almost twice the economy-wide average of 30 to 34%.
Does Kiosa replace my payroll or time tracking?
No. Kiosa calculates labor cost percentage and sales per labor hour from POS and labor data, but it doesn't replace payroll or standalone HR software. You see overtime and sick days from time tracking and the schedule; turnover remains a matter for your HR team.
Your next steps
Labor cost calculator: calculate your real labor cost percentage including all on-costs in a few minutes. The first building block of the six KPIs in this article.
30 minutes well spent. Want to see what labor cost percentage and sales per labor hour look like per location, updated daily, in the dashboard? Book a demo call and I'll show you with a concrete example.
Related terms
- Labor cost ratio: formula, benchmarks and typical mistakes
- Sales per labor hour: the productivity KPI, counterpart to labor cost percentage
- Staff turnover: calculation and cost of high staff churn
- Scheduling efficiency: how well the schedule matches actual demand
