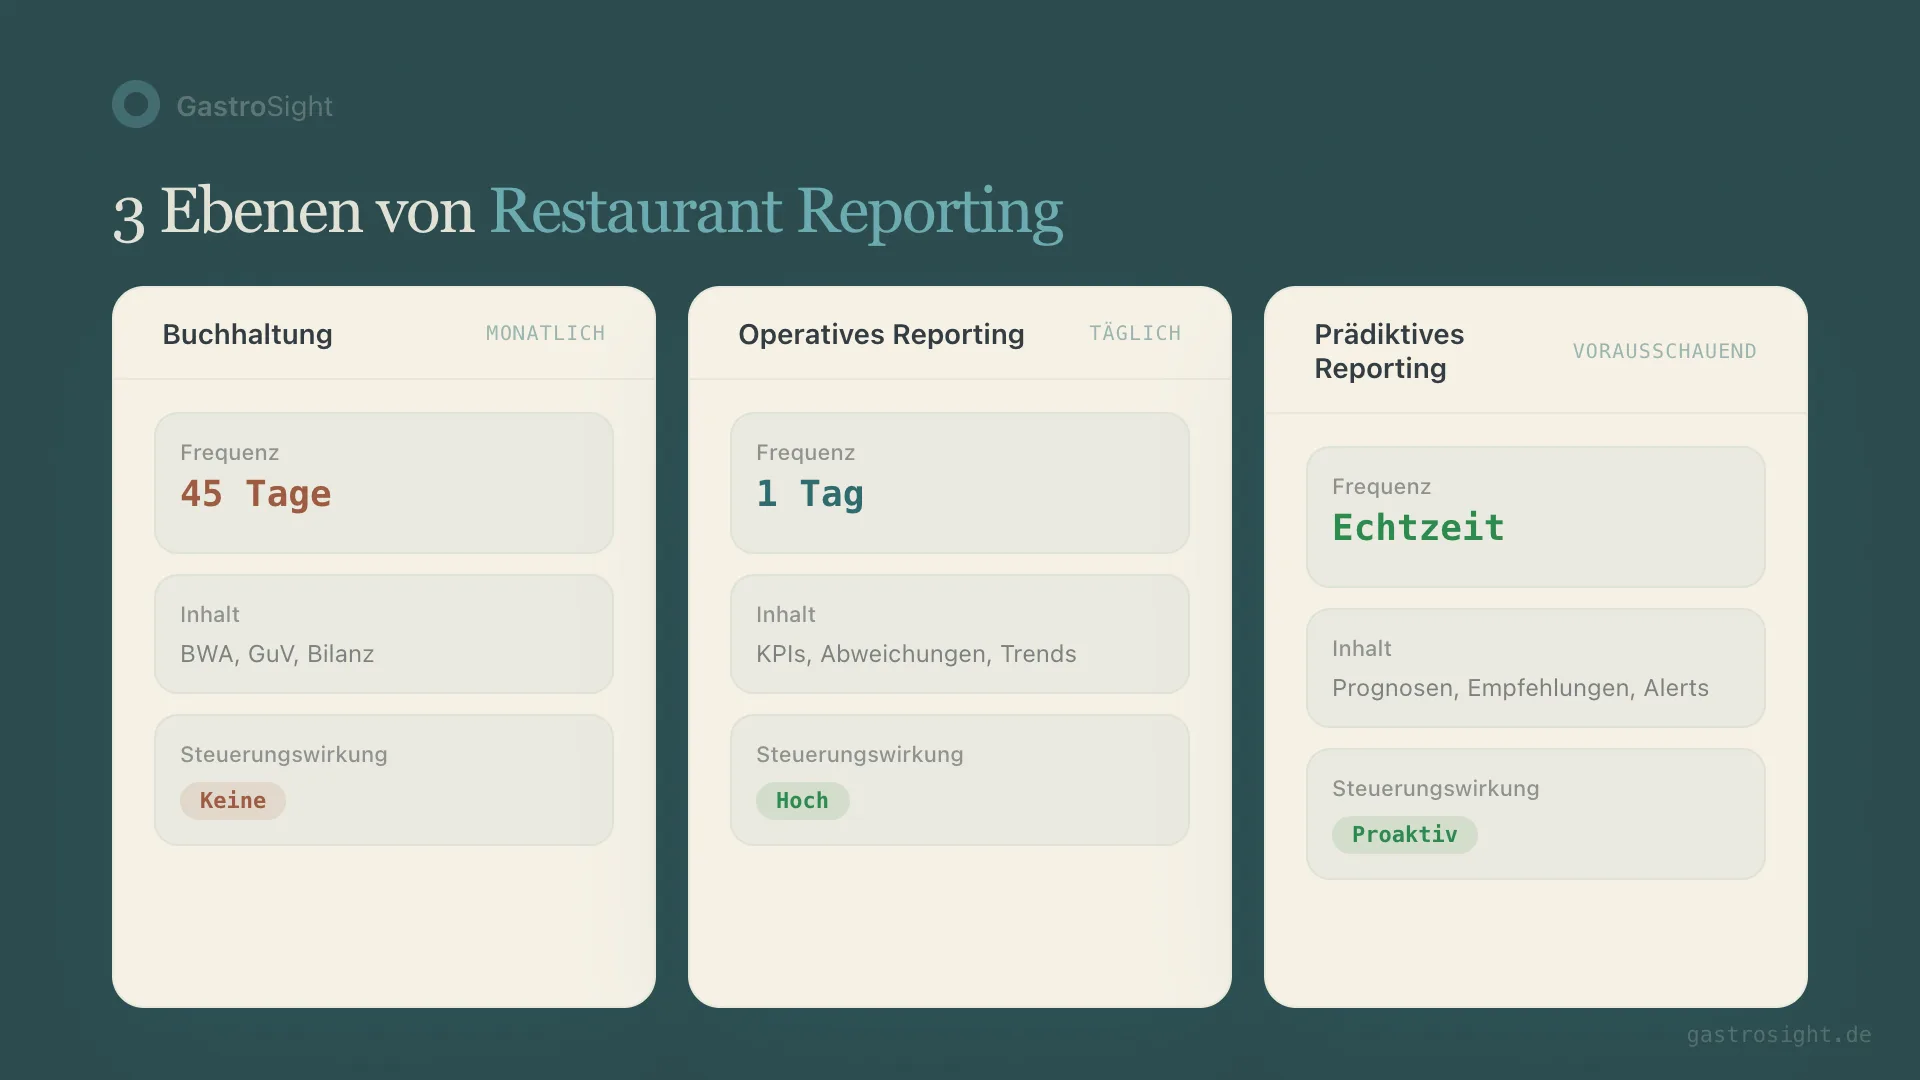
Restaurant reporting connects sales, labor hours and costs so you can make concrete decisions. A daily report explains deviations from plan; weekly reports reveal patterns, and the monthly P&L adds the financial view. When that P&L lands on your desk depends on how fast invoices flow and how your bookkeeping works. How often to look at which KPI, and the three mistakes that usually sink controlling, are covered in restaurant financial controlling: what to measure daily, weekly and monthly.
Operational restaurant reporting works differently. Not monthly, but daily. Not backward-looking, but steering. And not as a PDF in your inbox, but as a dashboard that shows the three most important deviations at 7 a.m.
What restaurant reporting really means
Reporting in hospitality has a basic problem: most operators confuse bookkeeping with steering. The monthly P&L tells you how last month went. It doesn't tell you why location 3 was 12% below plan on Tuesday, or whether that was down to staffing, the weather or a delivery problem.
Real operational reporting answers three questions:
What happened yesterday? Sales, labor cost, food cost, covers — broken down by location and compared with plan.
Why does it deviate? Not just the number, but the context. Was the labor cost percentage high because sales collapsed? Or because the rota didn't match guest demand?
What do I need to do today? Concrete recommendations, prioritised by impact.
The problem with Excel and monthly numbers
I ran restaurants with Excel for 15 years. Every morning: open the POS, export the numbers, paste them into the spreadsheet, check the formulas. That eats time before the first coffee has gone cold. With many locations, the effort doesn't grow linearly — it explodes.
The real problem isn't the time. It's the latency. If you only see on 15 February that January was bad, the causes are long gone. The employee who worked too much overtime is back on the February rota. The menu that pushed food cost up is still running.
Monthly numbers are a rear-view mirror. You need a windscreen.
Three symptoms that your reporting is too slow:
- You hear about problems through complaints rather than numbers
- Location managers report deviations verbally — with no data behind them
- You make decisions on gut feeling rather than KPIs
The five reports every operator needs daily
Not fifty KPIs. Five reports. If you need more, you're measuring the wrong things.
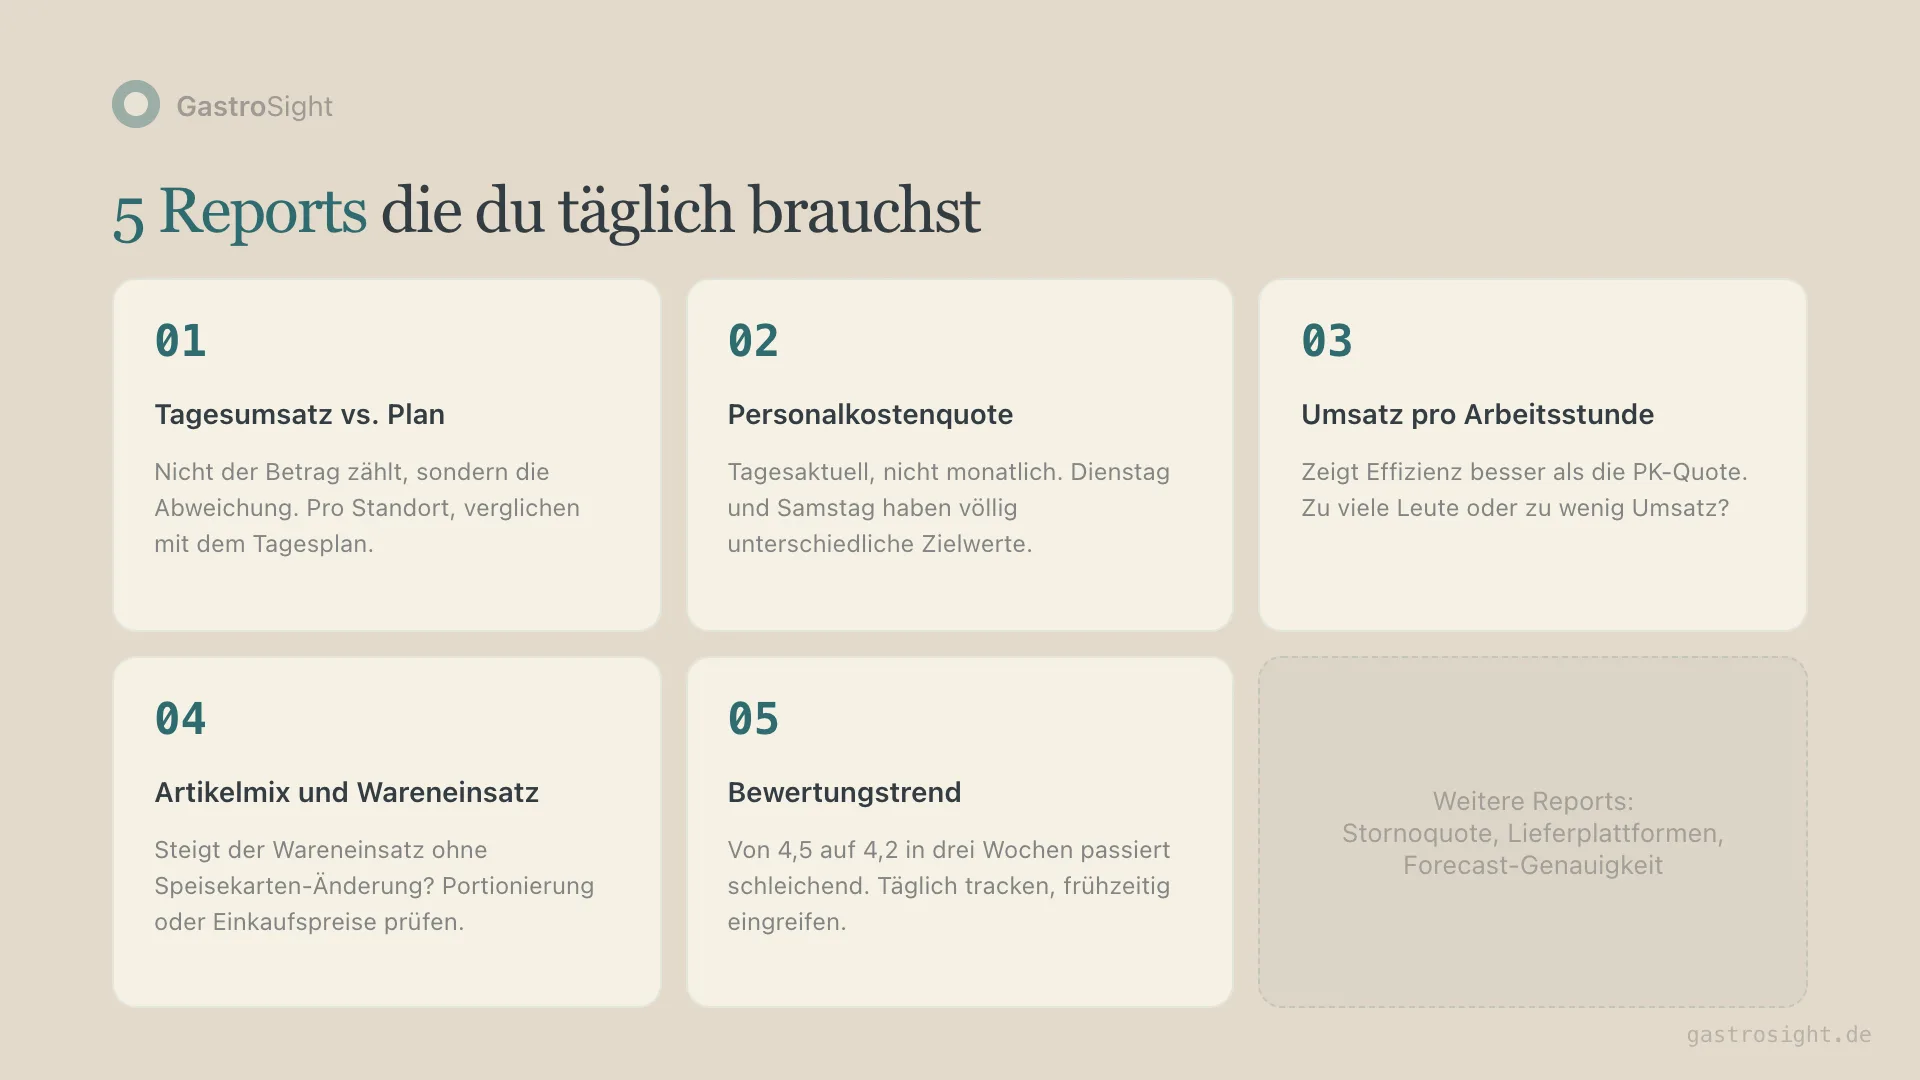
1. Daily sales vs. plan — by location
The most important number. Not absolute sales, but the deviation from plan. A location doing €8,000 a day can be good or bad — that depends on the plan. The deviation shows you where to look.
2. Labor cost percentage — updated daily
Calculating labor cost percentage on a monthly basis is like taking your temperature once a quarter. You need the daily value, compared with the benchmark for that weekday. Tuesday and Saturday have completely different targets.
3. Sales per labor hour
Labor cost percentage alone isn't enough. Two locations can have the same percentage but completely different efficiency. Sales per labor hour shows whether you had too many people for the sales — or whether the sales simply didn't come.
4. Item mix and food cost
If food cost rises without any change to the menu, something is wrong. Either portioning is drifting or purchase prices have gone up. Daily reporting shows you this straight away.
5. Review trend across platforms
Sliding from 4.5 to 4.2 in three weeks happens quietly. By the time you see it in the monthly report, the reviews are already written. A daily trend across Google, delivery platforms and others gives you the chance to step in operationally. How to maintain your Google profile so that reviews and visibility fit together is covered in the guide to optimising your Google Business Profile.
Why three systems are the problem
The data for these five reports sits in three different systems: the POS (sales, items), the staff system (hours, shifts) and accounting (costs, monthly P&L). None of these systems can deliver all five reports.
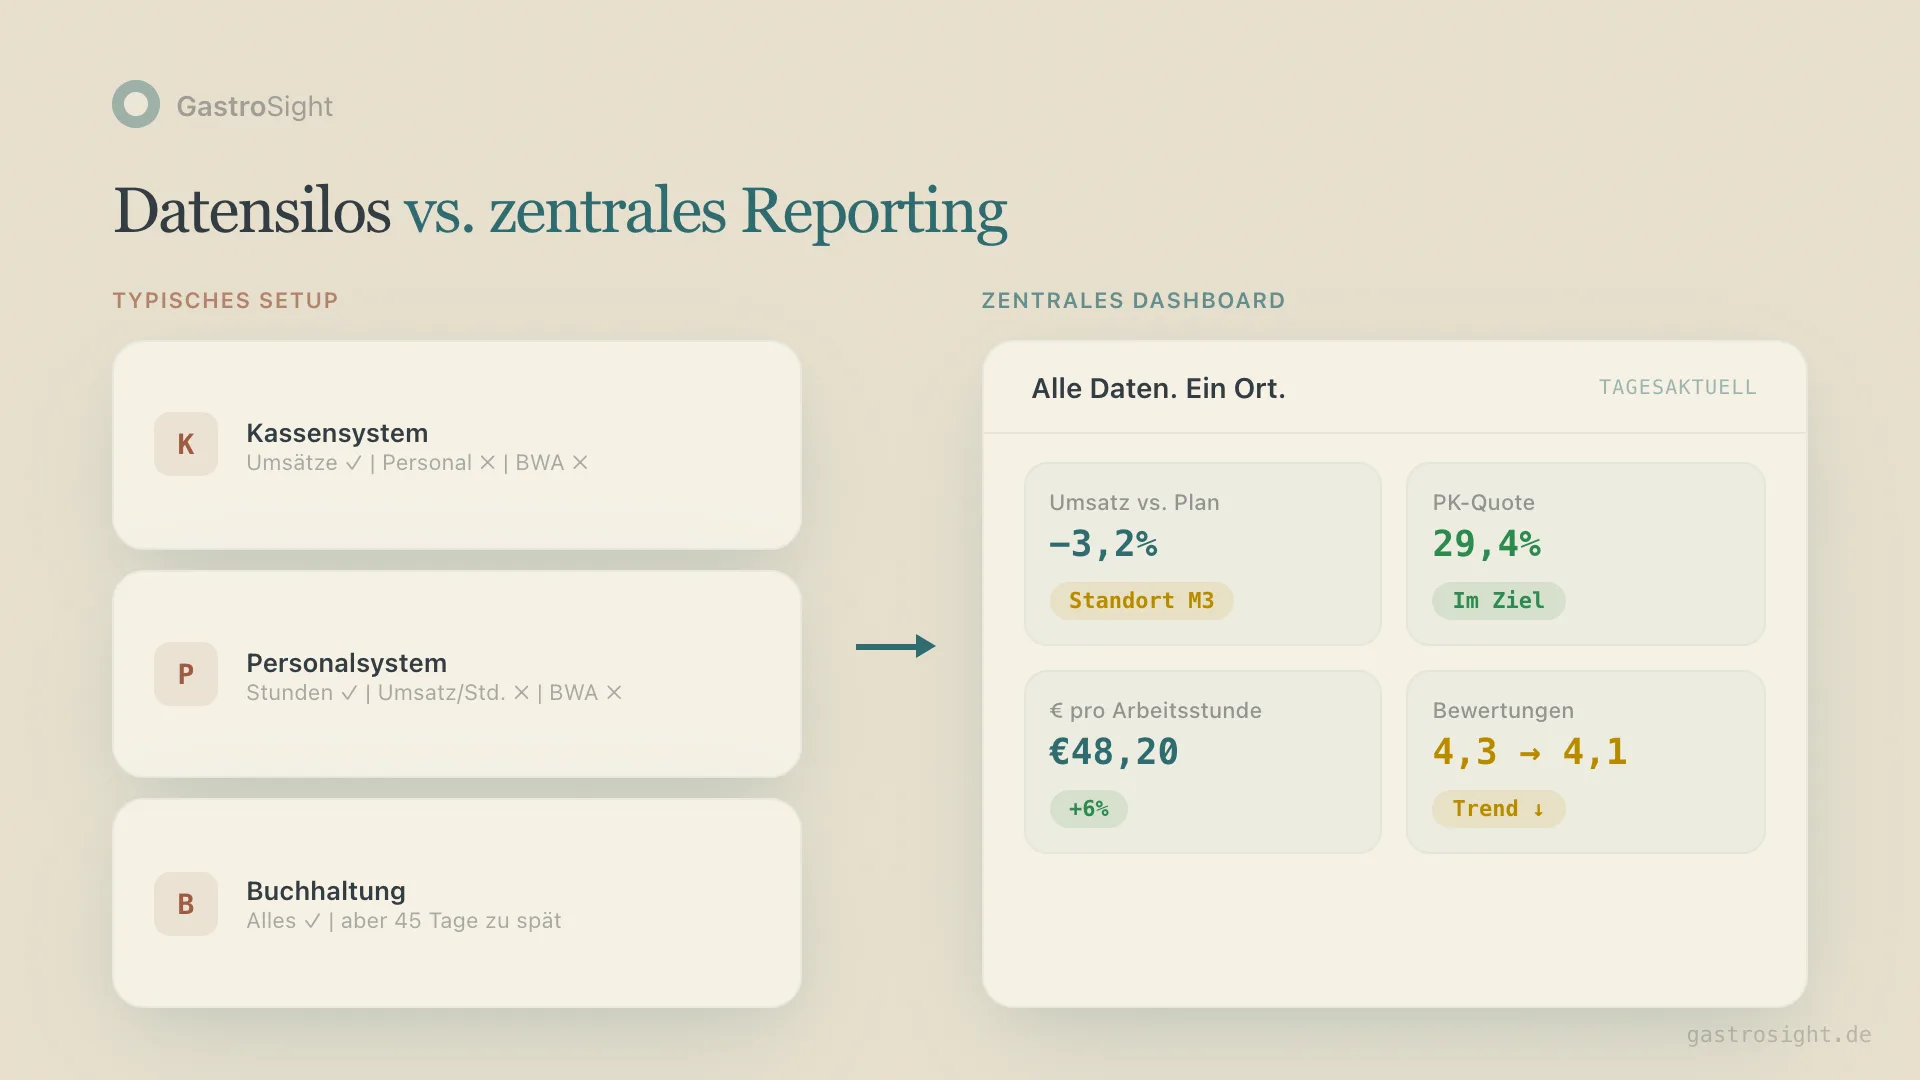
The POS knows sales, but not labor cost. The staff system knows hours, but not sales per hour. And accounting knows everything — 45 days too late.
The result: operators build Excel bridges. Manual exports, copy-paste, formulas that nobody except their author understands. And every POS update breaks something. When building it yourself in Excel or Power BI still makes sense is covered in the comparison of Excel, Power BI and Kiosa.
An operational restaurant dashboard solves this by combining POS and staff data automatically. Not as yet another system, but as a layer on top.
What separates good restaurant reporting from bad
Bad reporting shows numbers. Good reporting explains connections.
Bad: "Location M3 had a 31.8% labor cost percentage yesterday."
Good: "Location M3 had a 31.8% labor cost percentage yesterday (+2.3 percentage points above plan). Cause: 6 scheduled hours in the evening shift with 18% less revenue than forecast. Recommendation: review evening staffing on Tuesdays."
The difference: context and action. A number without explanation creates questions. A number with explanation creates decisions.
Four traits of operational reporting that works:
- Automatic: no manual exports, no copy-paste spreadsheets
- Daily: available in the morning, not halfway through the following month
- Contextual: not just the number, but the deviation from plan and possible causes
- Comparable across locations: benchmarks across all locations, not isolated single reports
The difference between reporting and controlling
Reporting shows you what happened. Controlling uses that data to make decisions. Each needs the other.
A restaurant with good reporting but no controlling process has nice dashboards that nobody uses. A restaurant with controlling ambitions but poor reporting makes decisions on incomplete data.
The sensible sequence:
- Collect data automatically — from POS, staff system and accounting
- Prepare daily reporting — deviations, trends, comparisons
- Weekly controlling — location manager reviews based on the numbers
- Monthly steering — reconcile the P&L result with the operational data
Most operators start at step 4 and wonder why steering doesn't work.
How an AI-assisted reporting system works
The next step after automated reporting is reporting that thinks along with you. Not science fiction, but pragmatic:
An AI morning briefing summarises the most important deviations each morning. Not 50 KPIs in a table, but three sentences: what stood out, why, and what you should do.
That doesn't replace the operator's experience. It can reduce manual Excel preparation; the actual time saved has to be measured in your own routine. The time freed up can then go into analysis and decisions.
With 10 locations, that means one briefing at 7 a.m. telling you where to look today. Not a system that produces 10 separate reports you have to piece together yourself.
From reporting to forecasting
Once you collect daily data over months, you have a basis for forecasts. What sales are realistic next Tuesday? How many hours do I need with a forecast of 25°C and a public holiday in the neighbouring town?
These forecasts don't replace the instinct of experienced managers. But they give that instinct a data-based foundation. And when you steer several locations, one person's gut feeling no longer scales.
Restaurant daily report: which data belongs together?
| KPI | Calculation or source | Important distinction |
|---|---|---|
| Net sales | closed POS data for the trading day | account for voids, discounts and sales tax |
| Sales deviation | actual sales minus planned sales | label both the euro and the percentage deviation |
| Sales per labor hour | net sales ÷ recorded actual hours | use the same locations and periods |
| Labor cost percentage | allocated labor cost ÷ net sales | distinguish estimated daily cost from processed payroll cost |
| Recipe-based food cost | quantities sold × recipe cost | this is a theoretical value, not measured stock usage |
| Observation and action | location manager adds the reason and next step | mark possible causes as hypotheses |
Fictional daily example: €4,800 net sales against a €5,000 plan is minus €200, or minus 4 per cent. With 60 recorded labor hours, sales per labor hour come to €80. Whether that is good depends on the right internal comparison — not on a generic industry traffic light. A weather or staffing explanation only follows once it has been checked.
For open questions, use the relevant deep dives: sales analysis, diagnosing a sales decline and labor scheduling based on sales. That turns daily numbers into concrete, verifiable tasks.
Implementing restaurant reporting: three steps
Step 1: Identify your data sources. Which POS, which staff system? Both need to be connected. Bookkeeping stays with your accountant; the monthly P&L completes the picture.
Step 2: Define a daily routine. Who looks at which numbers, and when? Without a routine, even the best dashboard gets ignored. A morning briefing by email or push notification is the easiest way in.
Step 3: Base controlling conversations on data. Run the weekly location manager meeting on the dashboard numbers, not on anecdotes. "Labor cost was 33.2%" is more concrete than "It was a tough month."
Want operational reporting for your locations? Book a demo and see your numbers in one dashboard — updated daily, across locations, with an AI briefing.
Related terms
- COGS — cost of goods sold: direct product costs in reporting
- Contribution margin — the central profit figure in reporting
- Break-even point — the profit threshold as a reporting target
From analysis to action
What this is about: setting up recurring daily, weekly and monthly reports.
Put it into practice:
