Restaurant business intelligence means your POS and labor data flow automatically into a system that shows you every day where each location stands, instead of weeks later in the monthly P&L. Kiosa starts with One View at €99 per location per month with no setup fee; further modules are added transparently per location. The benefit then has to be measured in analysis time saved and deviations actually caught, not in a blanket percentage promise.
For context: in our experience, an operator with 5 locations easily spends 12 hours a week pulling together numbers from the POS, labor scheduling and accounting. Business intelligence turns those 12 hours into 30 minutes. Which KPIs you manage with this data daily, weekly and monthly is covered in the article on restaurant financial controlling. The rest of this article explains how business intelligence and restaurant analytics are put together.
Contents
- What restaurant business intelligence actually is
- Why spreadsheets and the monthly P&L are not enough
- The three data sources that belong together
- BI maturity: reporting, analysis, forecasting
- Which questions your data answers
- Anomaly detection: why your system has to find problems before you look for them
- AI in restaurant BI: morning briefing and automatic explanations
- Multiple locations: where BI has the biggest leverage
- What matters in a solution
- What business intelligence costs and how to measure the benefit
- FAQ
What restaurant business intelligence actually is
Business intelligence is not a dashboard. A dashboard is only the surface.
Business intelligence for restaurants means: all the data from your business (sales, labor cost, food cost, covers, reviews) flows automatically into a system that shows you in seconds where you stand. Not in a monthly report. Every day.
I worked in multi-unit restaurant operations for 15 years, most recently with the Hamburg group Mama Trattoria (the business belongs to the founding family of Kiosa). The problem was never that we had too little data. The problem was that the data sat in several systems and nobody brought it together. The POS did not know what the scheduling tool was doing. The accounts arrived weeks too late. And the decisions in between? Gut feel.
Business intelligence solves exactly that problem. Not with more data, but with connected data.
Why spreadsheets and the monthly P&L are not enough
Two tools dominate restaurant controlling: spreadsheets and the monthly P&L from the accountant. Both have their place. Neither is business intelligence.
Spreadsheets can calculate anything. In theory. In practice, this is what happens: someone builds a sheet that works. Then that person leaves or changes the structure. Three months later nobody dares to touch the file. I know businesses that run their entire management on a spreadsheet built by a temporary waiter in 2019.
On top of that, spreadsheet data is manual. Someone types figures from the POS, compares them with the rota and works out the labor cost percentage. That takes 30-45 minutes per location. With 8 locations that is 4-6 hours a day, for yesterday's numbers.
The monthly P&L is a look back. It shows you what happened 4-8 weeks ago. If your food cost in January was 34% instead of 30%, you find out in March. Three months in which you spent €4,000-6,000 too much on stock every month without knowing it.
That is not controlling. That is history writing. Whether a spreadsheet or Power BI is enough for your business, and where maintenance gets expensive, is shown in the comparison of Excel, Power BI and Kiosa.
The three data sources that belong together
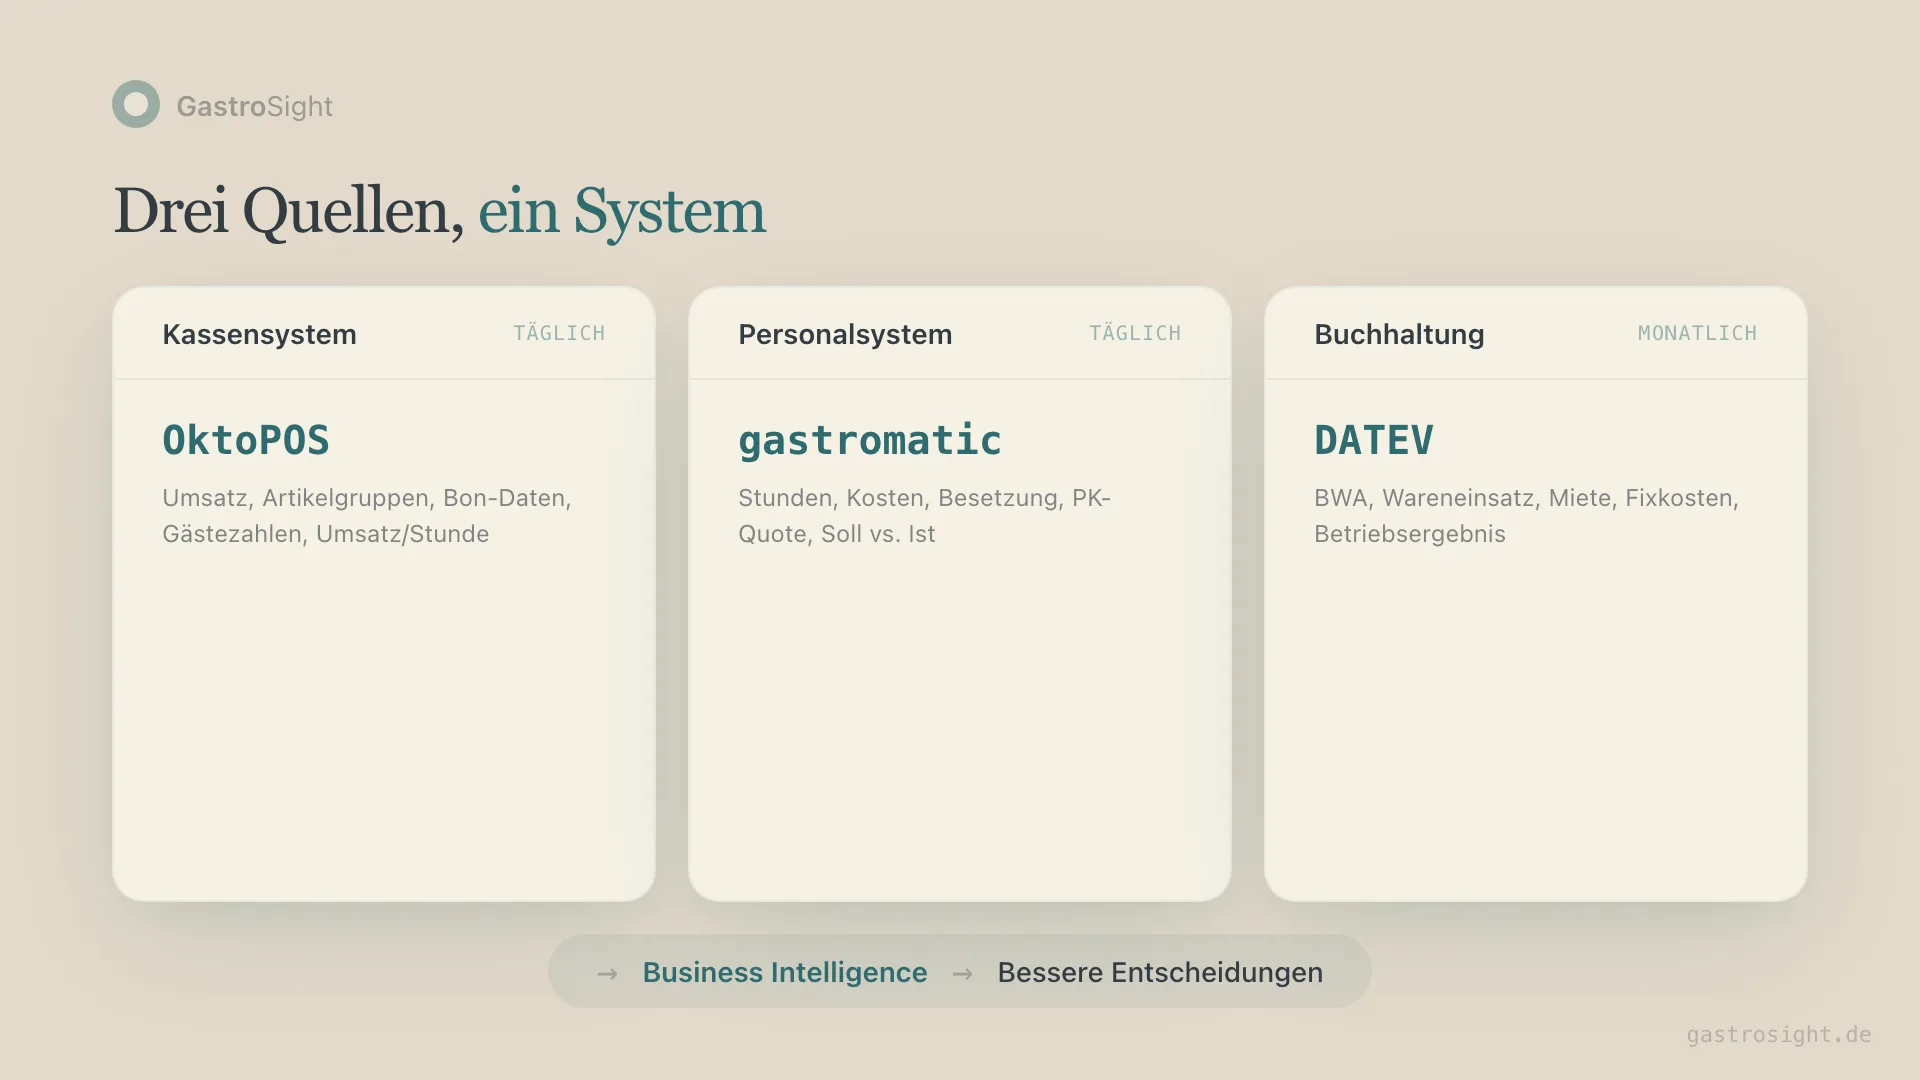
A BI system for restaurants has to connect at least three systems. If one is missing, the context is missing.
1. POS system (sales, item groups, check data)
The POS delivers total sales, sales by item group (drinks, food, desserts), average check, covers and sales per hour. At Kiosa this comes from OktoPOS or Hypersoft. What matters is that the data flows automatically and is current every day.
2. Labor system (hours, costs, staffing)
Labor is one of the biggest cost blocks in a restaurant. According to the German Federal Statistical Office, personnel expenses in German restaurants, bars, snack bars and cafés were 32.8% of sales in 2024 (2019: 30.6%; Destatis, table 48112-0001, our own calculation from personnel expenses and sales). What matters is your own trend per location and week. The labor cost percentage (labor cost as a percentage of sales) is the most important operational KPI. To calculate it daily you need planned hours, hours actually worked and hourly rates from the labor system. At Kiosa, labor data comes from gastromatic, e2n or ordio.
Without that connection you only see sales. Whether you made or lost money on those sales remains an open question.
3. Accounting (P&L, cost of goods, fixed costs)
The accounts provide the frame: cost of goods, rent, utilities and other expenses. Your accountant produces the monthly P&L. It is slower than POS and labor data (monthly instead of daily), but it completes the picture. Kiosa reads POS and labor data; the P&L stays with your accountant, and supplier invoices arrive by email in the Invoices module.
Only when all three sources come together do you get real business intelligence. You do not just see that you took €18,000 on Tuesday. You see that on those sales your labor cost percentage was 31.2% (2.2 percentage points above plan) because 3 servers too many were scheduled, while your food cost was on target at 29.8%.
BI maturity: reporting, analysis, forecasting
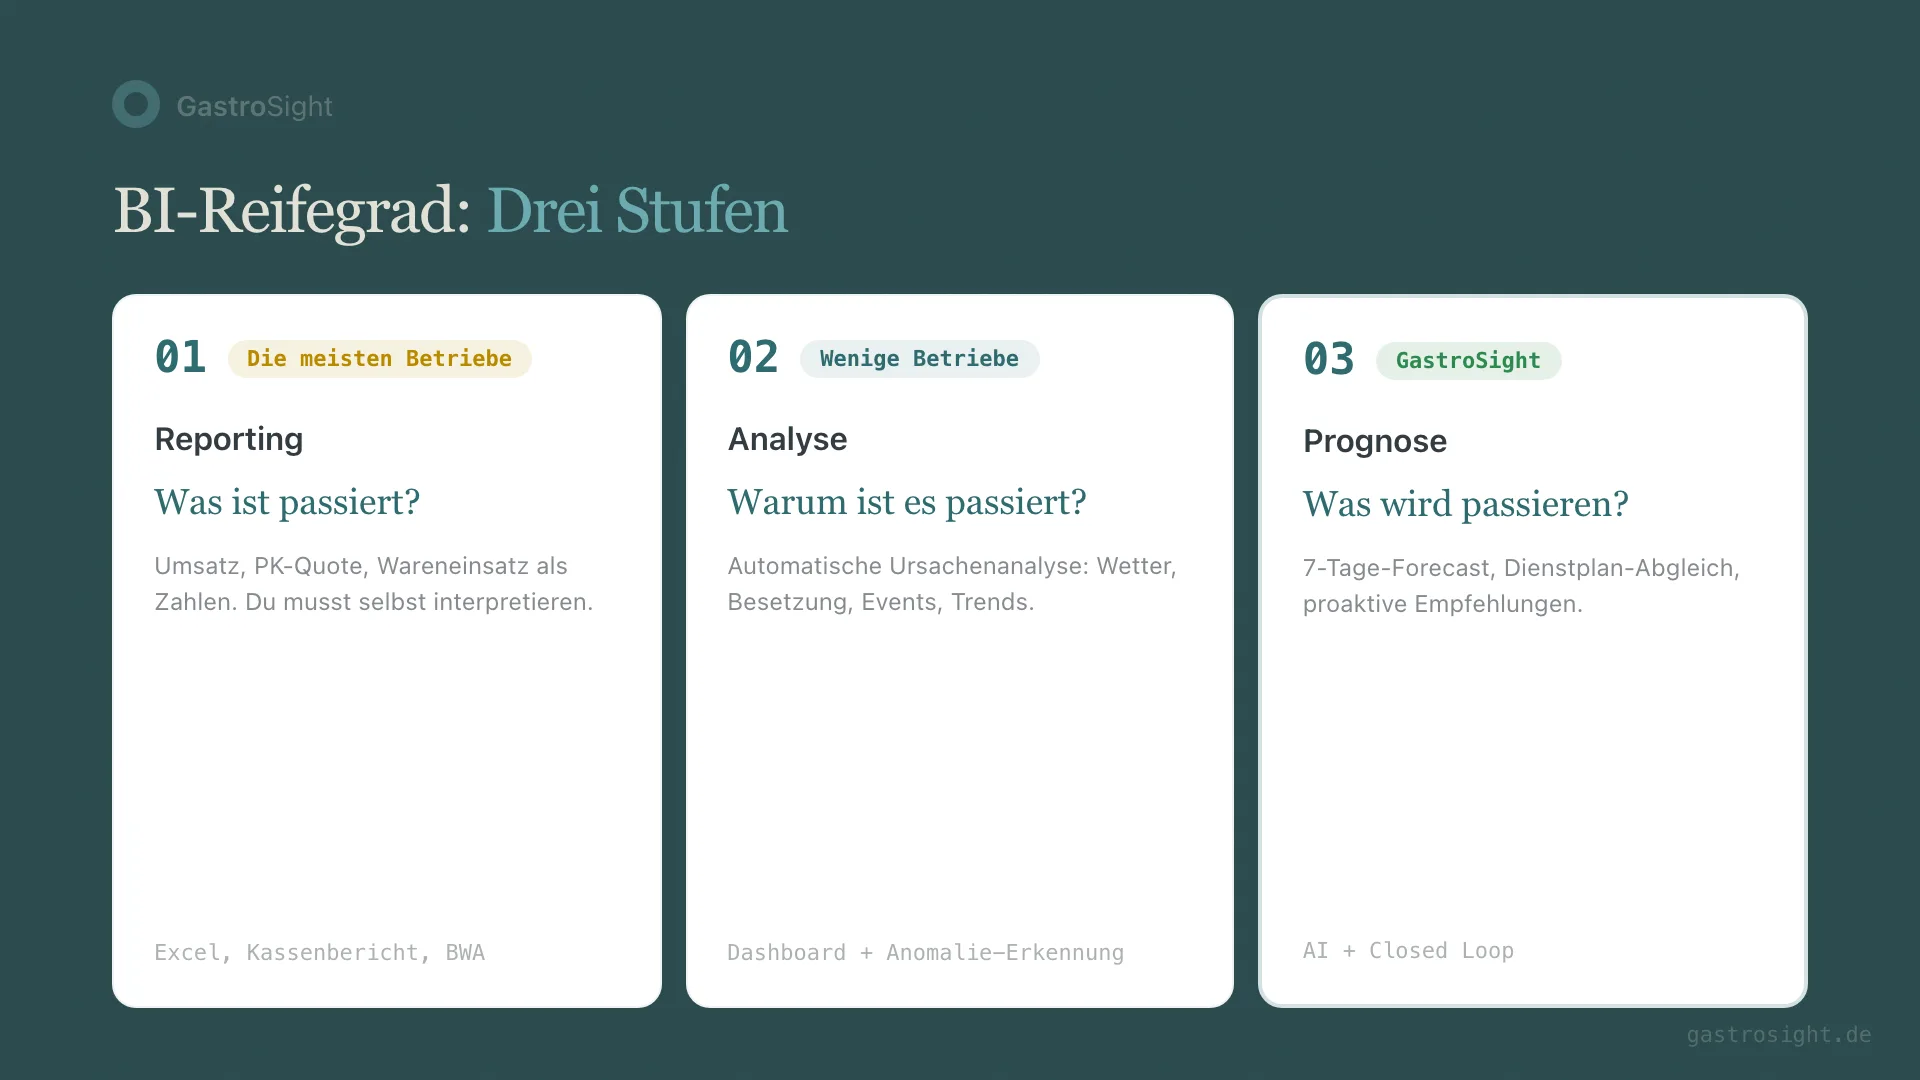
Business intelligence has three levels. Most restaurant businesses are stuck on level 1.
Level 1: Reporting. What happened?
You get numbers. Sales yesterday: €18,420. Labor cost percentage: 29.1%. Food cost: 30.4%. Better than nothing, but passive. You see results, but you have to work out yourself whether they are good or bad, and why.
Most POS systems and spreadsheet solutions deliver reporting. A few tables, a few charts, done.
Level 2: Analysis. Why did it happen?
This is where it gets interesting. Sales at location 5 on Tuesday were 19% below the 90-day average. Why? An analysis system automatically checks the weather (heavy rain, 23 mm), staffing (overstaffed 2pm-4pm), local events (none) and seasonal trends (none). Result: weather-related, not a structural problem.
This automatic root-cause analysis can shorten manual checks. How much time it actually saves has to be measured per role and process.
Level 3: Forecasting. What will happen?
The highest level: the system looks ahead. Based on historical data, the weather forecast and bookings, it forecasts sales for the next 7 days and checks that against your rota.
A concrete example: "Wednesday, location 3: 12 service hours scheduled, 8.5 hours recommended. Rain forecast, and historically -22% sales when it rains. Overstaffing likely."
Having this information on Monday instead of Wednesday evening is the difference between reacting and managing.
Which questions your data answers
Restaurant analytics is the practice behind the term: you ask management questions and answer them from connected data instead of compiling numbers by hand. The first step is attribution: which location, which trading day and which item group does a number belong to? Then you define sales tax, voids, discounts and the hours basis consistently. Only then do location comparisons make sense.
| Management question | Data basis | Further reading |
|---|---|---|
| Why are sales falling? | Checks, covers or transactions, net average check, comparison period | Restaurant sales analysis |
| Does staffing match demand? | Net sales, actual hours, forecast and opening hours | Labor scheduling based on sales |
| Why does usage differ from the recipe costing? | Sales, recipe costs, stock counts and stock movements | Actual vs theoretical food cost |
| Is weaker occupancy the problem? | Available seats, occupied time and covers | Table utilization and RevPASH |
Many systems deliver hundreds of metrics, most of them noise. For management, these seven KPIs are enough:
- Labor cost percentage: labor cost divided by net sales, the biggest lever in a restaurant. The right target depends on concept, opening hours, service level and cost definitions. Compare your own trend and similar locations rather than a generic health threshold.
- Sales per labor hour: net sales divided by recorded actual hours. A lower value can come from lower demand, more staffing or a different split of tasks; on its own it does not prove a scheduling problem.
- Average check: not every sales increase comes from more guests. There is often more potential in higher checks through better upselling or smarter menu design.
- Food cost percentage: cost of goods divided by sales, highly dependent on the concept. What matters is deviation from your own benchmark, not the absolute value.
- Covers and seat occupancy: 120 guests in an evening sounds good, but if they all arrive between 7pm and 8pm and the room is empty from 9pm, the distribution is wrong.
- Weather correlation: for restaurants with outdoor seating we see sales differences of 40 percent between a sunny day and a rainy day. If you know that, you schedule staff better.
- Forecast accuracy: the meta-KPI. Kiosa measures the deviation as MAPE. That is not a guaranteed maximum error for individual days: outliers can be considerably larger. For labor scheduling, the spread always matters alongside the average. Only the resulting adjustment of hours or purchasing can create an economic effect.
The formulas for these KPIs are in the article on restaurant KPIs.
Anomaly detection: why your system has to find problems before you look for them
With 3 locations you can go through every number every day. With 8 or 10 locations you cannot. You need a system that detects deviations automatically and tells you: something is wrong here.
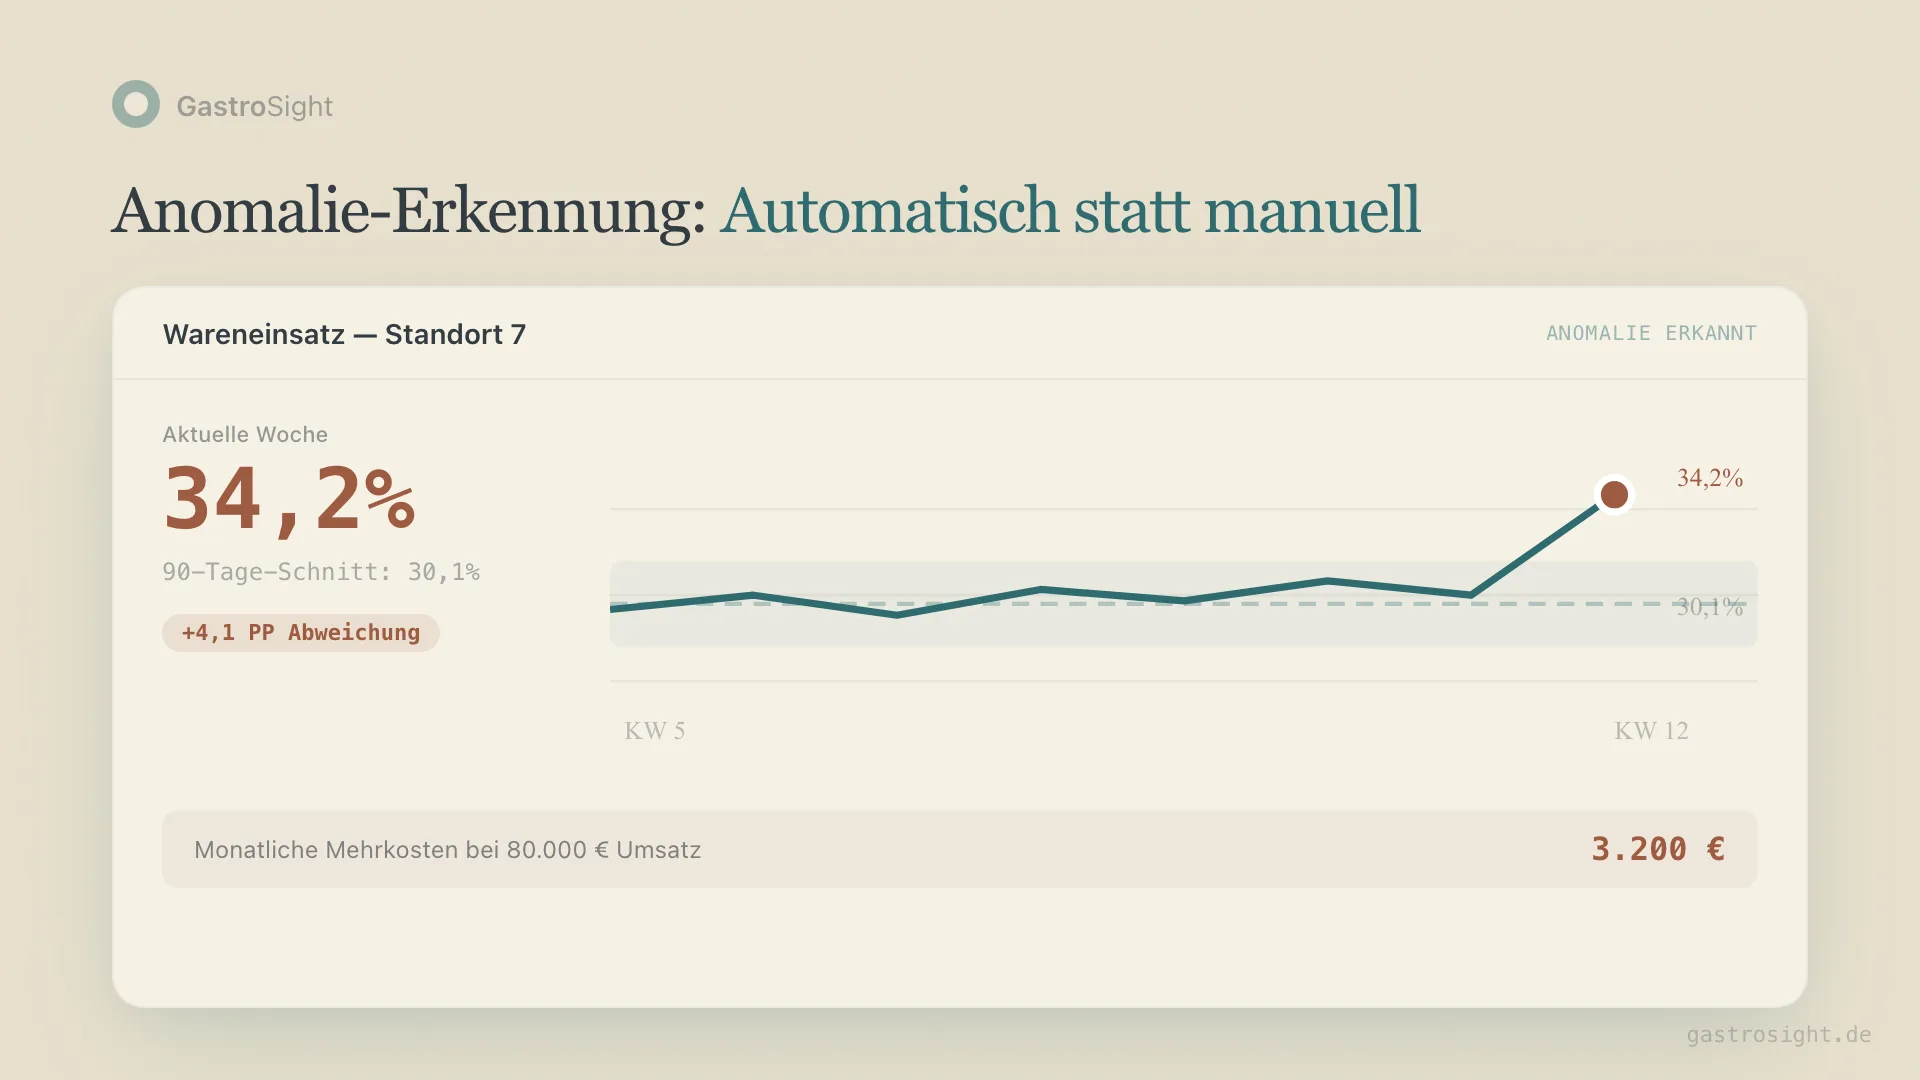
Anomaly detection compares every data point with its expected value. The expected value is based on the average of the same weekdays over the last 90 days, adjusted for public holidays and seasonal patterns. If a value falls outside the normal range, it is flagged.
A worked example (model business with 10 locations, not real operating data): food cost at location 7 last week: 34.2%. The 90-day average is 30.1%. That is a deviation of 4.1 percentage points. Possible causes: higher supplier prices, changed portion sizes, shrinkage. Without automatic detection this deviation would have disappeared in day-to-day business. At a location with €80,000 monthly sales, 4 percentage points of food cost deviation means €3,200 a month.
The decisive property of good anomaly detection: it only speaks up when it is worth it. No alert for normal fluctuation. No daily noise. Only patterns that cost money or save money.
AI in restaurant BI: morning briefing and automatic explanations
AI in restaurants is not a chatbot that takes reservations. In the context of business intelligence, AI means the system turns numbers into plain sentences and delivers recommendations.
Morning briefing: every morning at 7:00 the managing director receives an email. No table, no chart. Plain language.
Good morning. Your overview for Monday, 15 March:
Total sales yesterday: €18,420 (+4% vs. last week). Flag: Winterhude was 19% below plan, staff shortage (2 of 5 servers out). Recommendation: check whether the shortage also applies today.
3 locations above plan, 6 on plan, 1 below plan.
Thirty seconds to read, and you start the day informed. The general manager of each site gets their own version: only their locations, only their KPIs.
Automatic explanations: when the system finds an anomaly, AI supplies the explanation. Not "sales below average", but "sales 19% below average, probably weather-related (heavy rain 12 mm vs. average 3 mm), weather-sales correlation at this location: -0.72."
The AI logic at Kiosa is deliberately split in two: deterministic calculation for all numbers and comparisons, so no hallucinations and no wrong percentages. AI is used only for text generation, the last step that turns correct data into a readable sentence.
Closed loop: the system recommends, you act, the system measures the effect. Example (fictitious): recommendation: "Reduce Tuesday staffing in Eppendorf by 2 hours." Three weeks later: "Tuesday labor cost percentage down from 28.4% to 26.1%. Sales stable."
You can also query your Kiosa data directly in Claude or ChatGPT: the Kiosa AI plugin answers questions with the numbers you are allowed to see in Kiosa.
Multiple locations: where BI has the biggest leverage
You can run a single restaurant on experience and instinct. From three locations onwards that stops working: you cannot be everywhere at once, and your general managers use different yardsticks. What one reports as "busy", another calls "could be better".
BI creates a shared language: numbers against numbers instead of gut feel against gut feel. If location A has a labor cost percentage of 29.4 percent and location B 33.1, that is a 3.7 percentage point difference, which at €600,000 sales is €22,200 per year per location. The biggest gain is not control but knowledge transfer: if location A regularly performs 4 percentage points better than location B, it is worth asking what A does differently. Is it the team, the site, the menu structure or the pricing? Without data that stays speculation; with BI it becomes an evidence-based hypothesis you can test. The precondition is consistent definitions; how to compare locations fairly is shown in restaurant location benchmarking.
In the Mama Trattoria case study, Kiosa describes the use of a shared data basis for ten locations. The relationship with the founding family is disclosed there. The page serves as a traceable example of use; it does not publish an unconfirmed savings rate.
What matters in a solution
Not every dashboard is built the same. Three criteria separate useful systems from useless ones:
- Automatic data sync. Any system that needs manual input will be abandoned after two weeks. The data has to flow every day without you doing anything.
- Context. "Sales: €14,000" says nothing. "Sales: €14,000, 8 percent above plan, despite rain" is information.
- Actionable recommendations. Not generic ("reduce labor cost") but concrete ("cut the Tuesday evening shift by 1 person").
What you do not need: hundreds of metrics nobody understands, lengthy configuration before the first result, and consultants explaining what you see on your own dashboard.
The benefit grows with the data. After three months you have seasonal patterns, after six months year-on-year comparisons, after a year a complete cycle with holidays, school breaks and weather extremes. That makes the forecast more precise: if the system knows that the first warm Friday in April historically brings 35 percent more sales than a normal Friday, you can plan ahead instead of reacting. Not because the software learns, but because the data basis grows.
What business intelligence costs and how to measure the benefit
Whether business intelligence pays off cannot be answered with a blanket percentage. What matters is which manual work disappears and which concrete deviations the business catches earlier.
Costs: At Kiosa, One View costs €99 per location per month, with no setup fee. Optional modules are Inventory for €49 and Invoices, Loyalty and Scheduling for €99 each per location per month. The full stack costs €445 per location per month. All modules and example calculations are on the Kiosa pricing page.
For a business with five locations, One View therefore costs €495 a month. Which additional modules make economic sense depends on the systems you already have and the specific process problem.
How to measure the benefit:
- Before you start, record for four weeks how many minutes per week go into exporting, combining and preparing data.
- Document every deviation caught with its date, the action taken and the result actually achieved.
- Deduct licence costs, internal rollout time and variable costs from the effects achieved.
- Evaluate time saved and improved results separately so they are not counted twice.
An example calculation is only reliable when it uses the business's real starting values. That is why Kiosa does not promise a fixed ROI or a blanket percentage.
From analysis to action
What this is about: data architecture, bringing POS, staff and accounting data together, and the management questions it can answer.
Put it into practice: Kiosa One View as a shared data foundation
More on Controlling and finance
- Restaurant Financial Controlling: What to Measure Daily, Weekly and Monthly
- Restaurant Daily Report: What Belongs in It and Why
- Restaurant Sales Analysis: Break Sales Down into Its Drivers
FAQ
Do I need business intelligence with just 2-3 locations?
Central reporting can make sense from two locations. The relevant tipping point, however, is not a fixed number of locations or level of sales, but the manual effort, the number of data sources and how quickly deviations are caught today.
Which POS systems work with a BI system?
In principle any POS system that exports data or has an API. The question is not whether, but how much work the integration takes. At Kiosa, OktoPOS and Hypersoft are connected directly, and the POS integration is part of the setup. For other POS systems we check the connection in the first call. Which systems Kiosa reads for POS and labor is listed under integrations.
What is the difference between BI and controlling?
Controlling is the discipline, BI is the tool. Your controller or accountant does controlling with spreadsheets, the monthly P&L and manual analysis. BI automates data collection and preparation and gives controlling daily rather than monthly numbers. Good BI does not replace a controller. It makes them faster and more precise.
How long does the rollout take?
That depends on the number of locations, access and data quality. Most of the time goes into aligning the data sources: which POS, which labor system, which location mapping. We set up the system connections together with you.
Is my data secure?
All data is stored on servers in Germany (Hetzner, Frankfurt). No Google Analytics, no Facebook Pixel, no sharing with third parties. GDPR-compliant. Your data belongs to you: when the contract ends you get a complete export.
Your next steps
Want to know what business intelligence would look like for your business? Three options:
1. Free demo: we show you a live dashboard with real restaurant data. 30 minutes, no sales pitch. Book a demo
2. Labor cost calculator: work out in 2 minutes how your labor cost percentage compares. Go to the labor cost calculator
3. Write directly: no form, no chatbot. Send an email to sven@kiosa.ai and I will reply personally.
Related terms
- Anomaly detection: automatic detection of unusual data patterns in the business
- Forecasting: sales forecasts based on historical data and patterns
- Contribution margin: sales minus variable costs as a management metric
