A restaurant sales analysis breaks sales down into its three drivers — covers × average spend × trading days — and compares them across weekdays and locations. Only this breakdown shows why sales moved, not just that they did. The most honest efficiency metric along the way: sales per labor hour. Formulas for average spend, sales per labor hour and the other core values are collected in the most important restaurant KPIs.
Why this is necessary: €35,100 weekly sales. Sounds good. Until you look at how the number is distributed: €3,200 on Monday, €7,200 on Saturday. Monday eats margin, Saturday earns it. But in the manager's head it was "a normal week".
That's the problem with daily sales as the only KPI. It tells you how much money came in. Not why. And without the why, you don't make better decisions.
Contents
- The sales formula: three levers instead of one number
- Weekday analysis: which days make money and which burn it
- Location comparison: same brand, different reality
- Sales per labor hour: the most honest efficiency indicator
- Forecast vs. actual: know in the morning what today will bring
- What you can do this week
The sales formula: three levers instead of one number
Every restaurant's sales can be broken down into three drivers:
Sales = covers x average spend x trading days
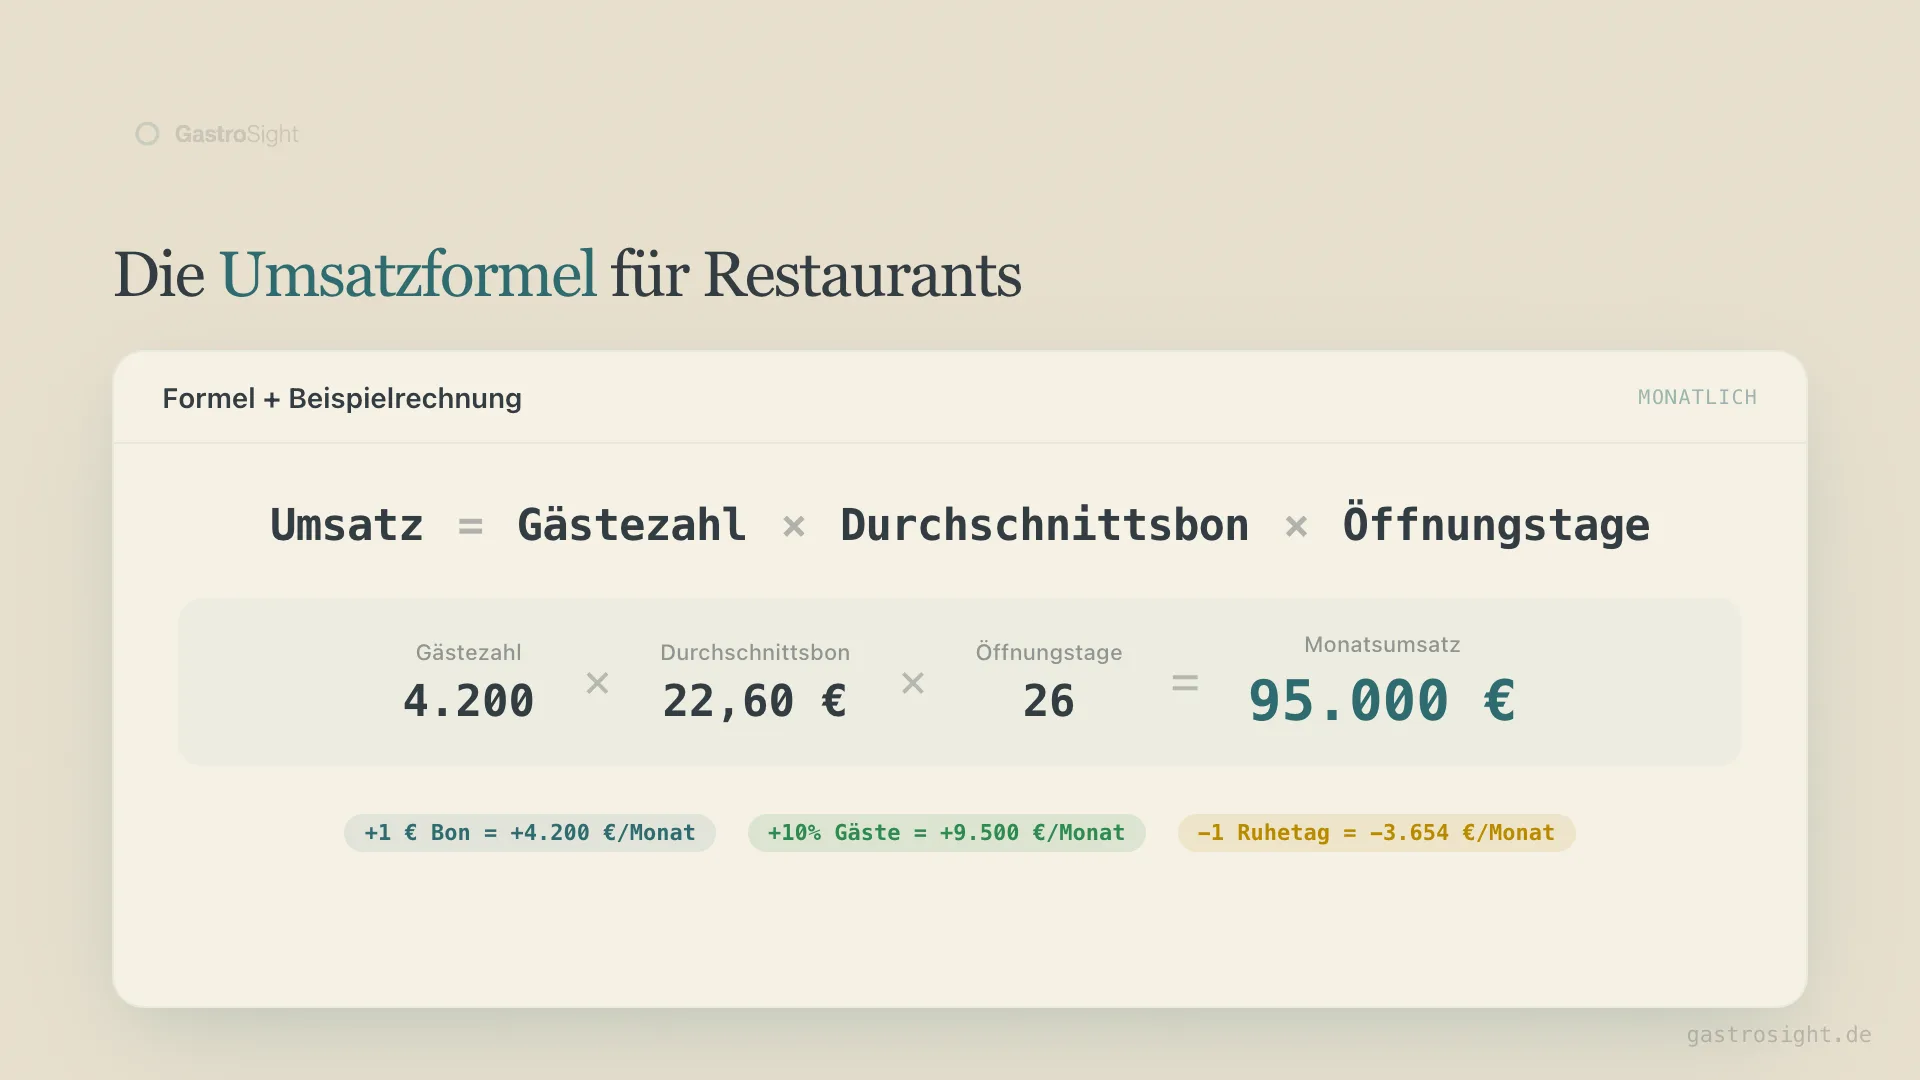
Most operators only track total sales. They don't know which lever moved.
An example. Restaurant A does €95,000 in March and €88,000 in April. Minus 7.4%. The first reaction: "April was weak." But what exactly was weak?
| March | April | Change | |
|---|---|---|---|
| Covers | 4,200 | 4,400 | +4.8% |
| Average spend | €22.60 | €20.00 | -11.5% |
| Trading days | 26 | 26 | 0% |
| Sales | €95,000 | €88,000 | -7.4% |
More guests actually came. Sales still fell — because average spend dropped by €2.60. Across 4,400 guests, that's a difference of €11,440.
The cause: in April, a lunch promotion with a reduced menu was running. More footfall, less value per visit. Without breaking it down into drivers, you'd have said "weak month" and carried on.
The three levers work differently:
Covers rise through marketing, location, weather, events. Hard to influence in the short term, expensive to buy.
Average spend rises through upselling, menu design and server training. Costs almost nothing, delivers 5-15% uplift. The most underrated lever.
Trading days work both ways. An additional closed day doesn't just cost that day's sales — it costs the fixed costs that keep running: rent, insurance, leasing.
Weekday analysis: which days make money and which burn it
The average week doesn't exist. Every weekday has its own profile.
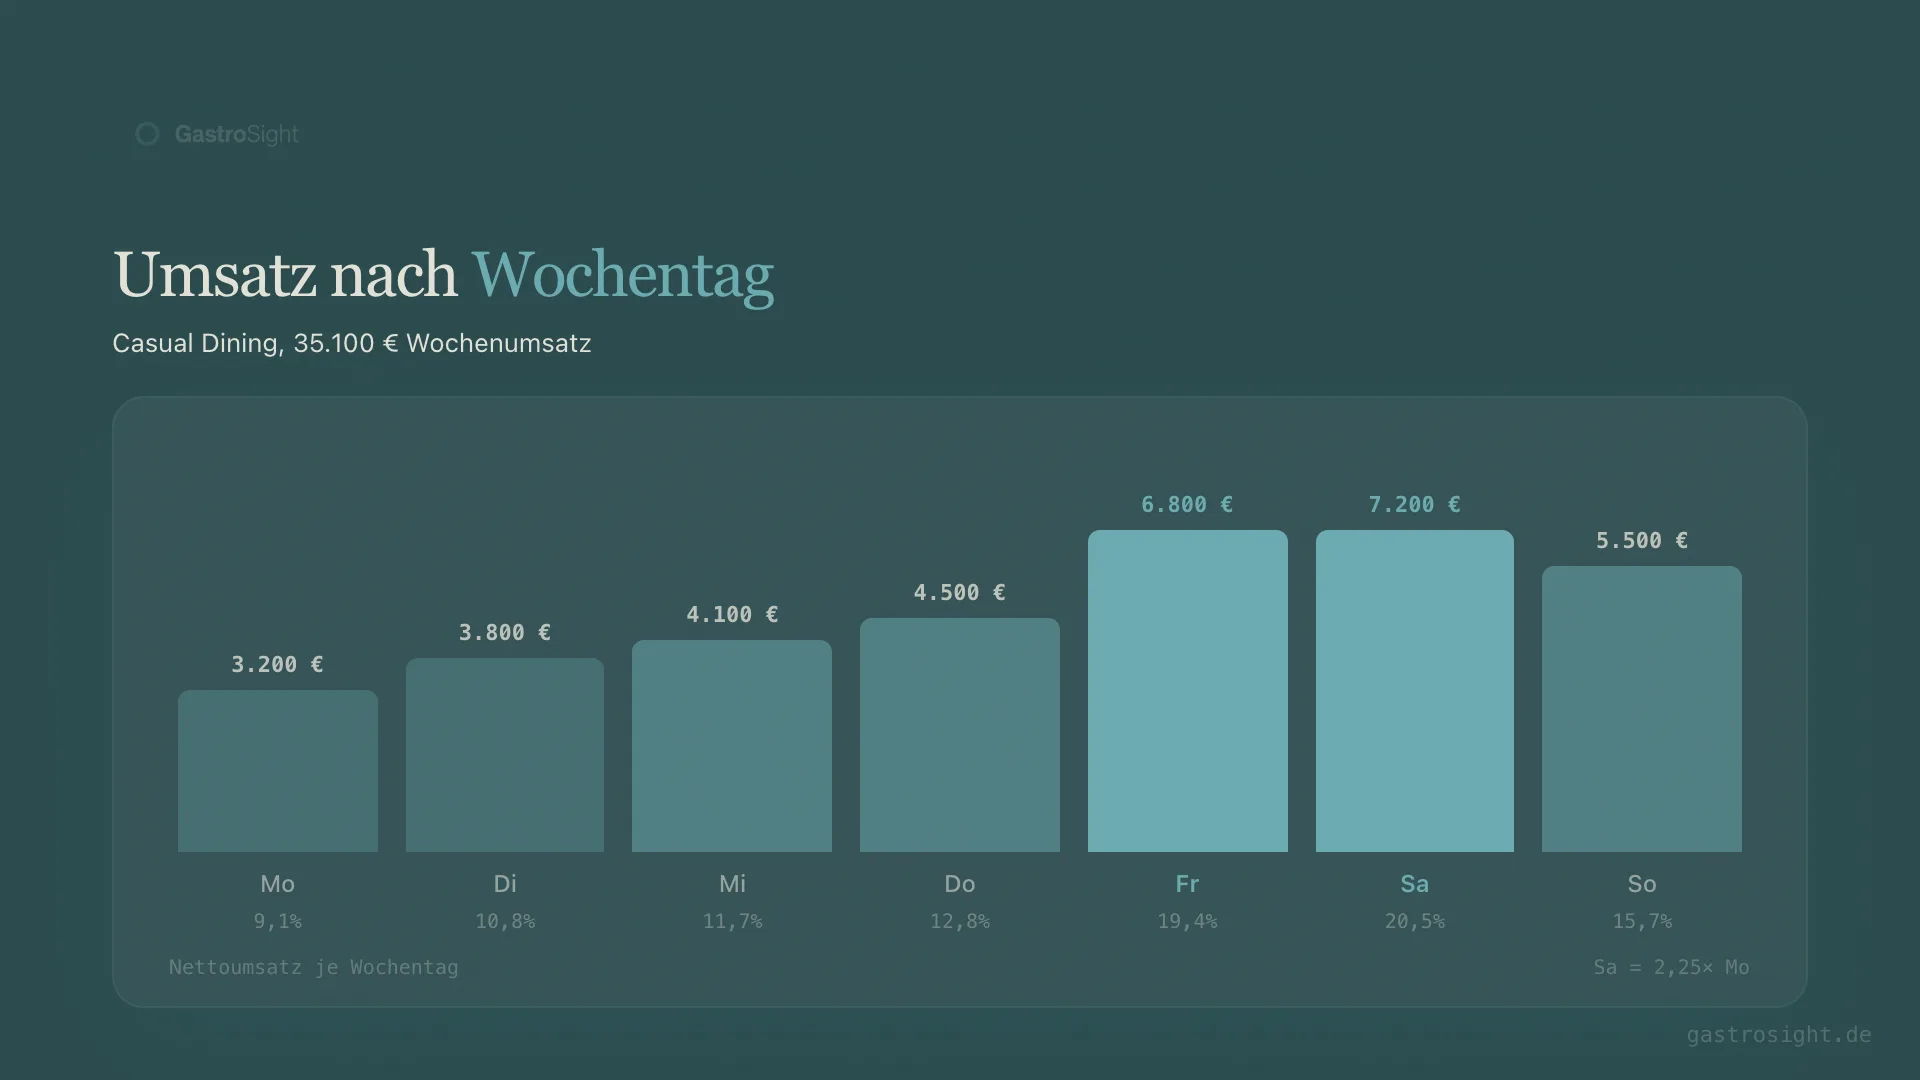
Here is the weekly distribution of a casual dining restaurant with €35,100 weekly sales:
| Day | Sales | Share | Labor hours | Sales/hour |
|---|---|---|---|---|
| Monday | €3,200 | 9.1% | 48 | €66.70 |
| Tuesday | €3,800 | 10.8% | 50 | €76.00 |
| Wednesday | €4,100 | 11.7% | 52 | €78.80 |
| Thursday | €4,500 | 12.8% | 54 | €83.30 |
| Friday | €6,800 | 19.4% | 72 | €94.40 |
| Saturday | €7,200 | 20.5% | 74 | €97.30 |
| Sunday | €5,500 | 15.7% | 62 | €88.70 |
Saturday brings in 2.25x as much revenue as Monday. But only 1.54x as many labor hours. Saturday isn't just stronger in sales — it's also more efficient.
Monday has the lowest sales per labor hour: €66.70. 31% below Saturday. If your target benchmark is €80, every Monday hour burns money.
What you can take from this:
Redistribute labor hours. Fewer people on Monday, more on Friday. Moving one hour from Monday to Friday brings €27.70 more sales per labor hour. Sounds small. Over a year: €1,440 — per hour moved. With ten locations and three hours moved each: €43,200.
Place promotions deliberately. Tuesday does €3,800. A Tuesday offer — pasta night, wine special — lifts covers without proportionally more staff. 15% more guests on Tuesday with the same staffing: €570 more sales per week, labor cost unchanged. That's €29,640 a year.
Check a closed day. If Monday is permanently below the efficiency benchmark, work out whether a closed day would make more economic sense. €3,200 sales minus labor cost, food cost and variable costs — often less is left than the fixed costs of the day.
Location comparison: same brand, different reality
From five locations upwards, location comparison becomes the most important steering tool. Not because you need competition between branches. But because outliers show where potential lies — or where a problem is growing.
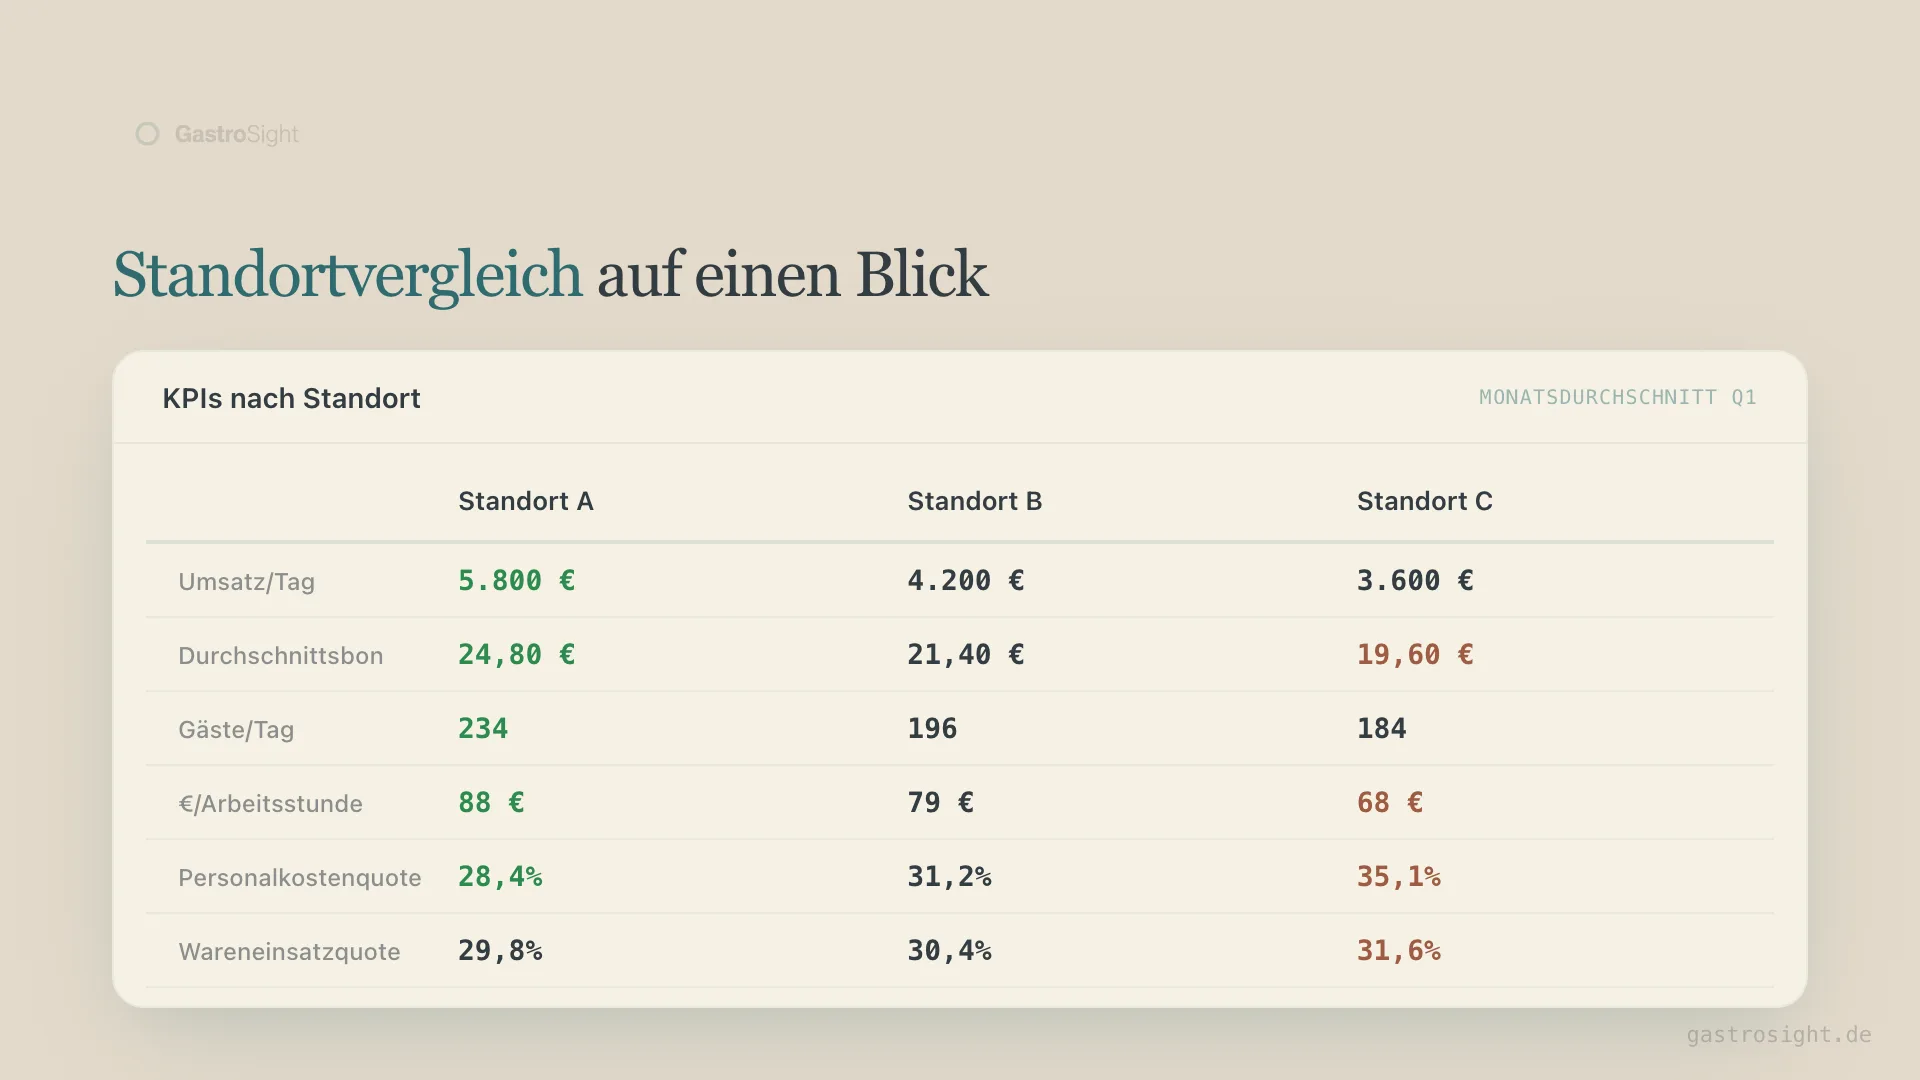
Three locations, same brand, same concept — a model example with three locations (model business, not real operating data):
| KPI | Location A (city centre) | Location B (urban district) | Location C (suburb) |
|---|---|---|---|
| Sales/day | €5,800 | €4,200 | €3,600 |
| Average spend | €24.80 | €21.40 | €19.60 |
| Guests/day | 234 | 196 | 184 |
| Sales per labor hour | €88 | €79 | €68 |
| Labor cost percentage | 28.4% | 31.2% | 35.1% |
| Food cost percentage | 29.8% | 30.4% | 31.6% |
Location C has a problem. Not because of its lower sales — a suburban site has less passing trade. The problem is efficiency: a 35.1% labor cost percentage with an average spend of €19.60.
The right question isn't "Why does C make less than A?" — the location explains that. The question is: "Why are sales per labor hour 23% below A, when guest numbers are only 21% lower?"
Possible causes:
- Too many labor hours relative to guest volume.
- A weak sales mix: fewer drinks, fewer desserts, lower average spend.
- Inefficient section planning: four service sections where three would do.
Without the location comparison, this goes unnoticed. Location C makes its €3,600 a day, the manager is satisfied. Only in comparison does it become visible that 6.7 percentage points of labor cost lie between A and C. On €1.1 million annual sales: €73,700. Before tax.
Three rules for location comparison
- Same sales basis. Gross or net — but identical everywhere. Mixing the two makes any comparison worthless.
- Same definition of hours. Do breaks count? Does the manager count as a labor hour? Different definitions shift sales per labor hour by 10-15%.
- Mind seasonality. A location with outdoor seating has different numbers in summer than in winter. Compare quarter with quarter, not July with January.
Sales per labor hour: the most honest efficiency indicator
Labor cost percentage is the most important monthly KPI. For daily steering, you need sales per labor hour.
Labor cost percentage is influenced by wage levels, employer contributions and the share of casual staff. Sales per labor hour measures only operational efficiency: how much revenue does one hour of labor generate?
Sales per labor hour = net sales / hours worked
Illustrative planning values by business type — not an analysis of Kiosa customer data and not official statistics:
| Business type | Reference value | Typical range |
|---|---|---|
| Quick service / fast casual | €90-110 | €70-130 |
| Casual dining | €65-85 | €50-100 |
| Fine dining | €50-70 | €35-90 |
The absolute value says little. Only the deviation from your own average matters. If your restaurant normally sits at €82 and suddenly shows €58 on Tuesday, something is off. Either sales were unusually low (public holiday, roadworks, weather) or you had too many people in.
The strength: the metric works at day, shift and hour level. You can compare the lunch shift with the evening shift, Tuesday with Friday, January with June. Always the same logic.
How to derive a labor hour budget from sales per labor hour is shown in labor scheduling based on sales.
Forecast vs. actual: know in the morning what today will bring
The best sales analysis is the one you use before the day is over. Not in the monthly report on the 15th of the following month. Not in the Excel report on Sunday evening.
A sales forecast is based on historical data: the average of the last eight weeks, adjusted for public holidays and seasonality. Surprisingly few businesses do it.
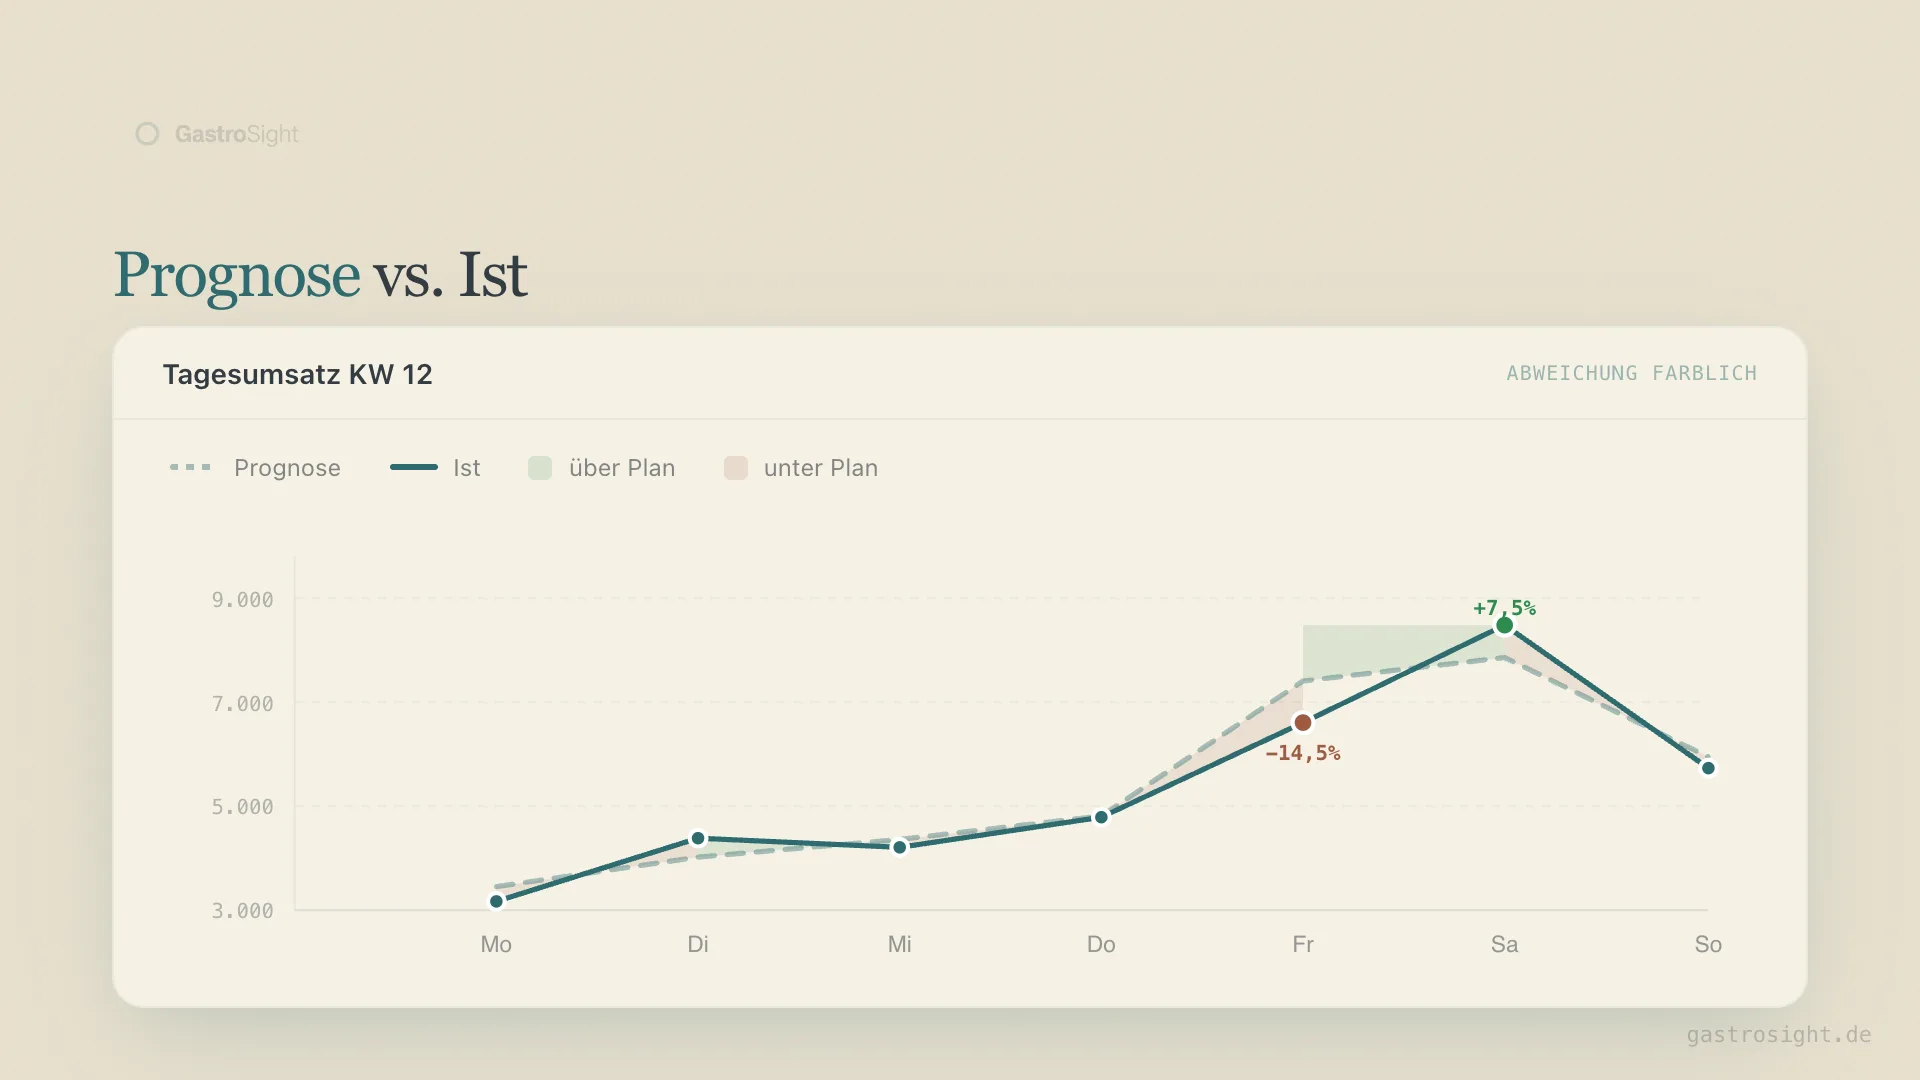
An example of a week with forecast and actual comparison:
| Day | Forecast | Actual | Deviation | Cause |
|---|---|---|---|---|
| Monday | €3,400 | €3,150 | -7.4% | Rain, terrace empty |
| Tuesday | €3,900 | €4,220 | +8.2% | Trade fair visitors, unplanned |
| Wednesday | €4,200 | €4,050 | -3.6% | Within range |
| Thursday | €4,600 | €4,580 | -0.4% | Spot on |
| Friday | €6,900 | €5,900 | -14.5% | Staff absence, tables closed |
| Saturday | €7,300 | €7,850 | +7.5% | Event demand in the neighbourhood |
| Sunday | €5,600 | €5,400 | -3.6% | Within range |
Friday stands out: -14.5%, that's €1,000 below plan. A server was off sick, two tables stayed closed all evening. That isn't a sales problem — it's a staffing problem that shows up in sales.
Without a forecast, you only notice at month end. With a forecast, you notice on Saturday morning and correct course for next Friday.
What a good forecast needs
Three data points are enough:
- Historical average per weekday. Last eight weeks, median rather than mean — less sensitive to outliers.
- Correction for special days. Public holidays, school holidays, local events. A bank holiday Monday isn't a normal Monday.
- Weather correction. For locations with outdoor seating: 25 degrees and sunshine can lift daily sales by 30-40%. Or push them down, if everyone's sitting in the park.
The forecast doesn't need to be accurate to the euro. Plus or minus 5% is enough. The value lies in spotting outliers — not in hitting the number exactly.
What you can do this week
Three steps you can implement straight away:
Driver breakdown for last month. Export from your POS: total sales, number of transactions, trading days. Calculate covers and average spend. Where's the movement compared with the previous month?
Build a weekday profile. Last four weeks, average sales per weekday, share of weekly sales. You'll see patterns you sensed intuitively but never put a number on.
Add labor hours. Sales per labor hour for each weekday. Which day is below €70? It needs fewer staff or more guests.
For one location, that takes an hour. For five or ten locations, Excel gets messy. That's exactly why we built Kiosa: POS data and staff data in one dashboard — with automatic sales analysis, location comparison and daily forecast.
Book a demo — in 15 minutes you'll see what sales analysis looks like for your locations.
Related terms
- RevPASH — revenue per available seat per hour
- Average spend — average revenue per guest or transaction
- Table utilization — occupancy rate of available seats
- Anomaly detection — automatic detection of unusual sales patterns
From analysis to action
What this is about: breaking sales down into drivers and analysing locations on a comparable basis.
Put it into practice: Sales analysis in Kiosa One View
