Good restaurant financial controlling runs on three rhythms: daily, the 5 variance KPIs (sales against comparison, sales per labor hour, average check, void rate, anomalies); weekly, labor cost % and food cost % per location; monthly, prime cost and operating profit from the P&L. The monthly P&L alone isn't enough — it arrives 3 to 4 weeks too late.
Why I can say that so plainly: 45 minutes. Every morning. Open three systems, dig out the numbers, type them into Excel, compare them with the day before. Then repeat the whole thing for every location.
That was my morning when I ran 10 Mama Trattoria locations in Hamburg (the business belongs to Kiosa's founding family). The problem wasn't missing numbers. I had too many — in too many systems, with too much delay. Controlling was a month-end ritual, not a steering tool.
This article shows you which KPIs you need at which rhythm. Not everything at once, but on one principle: spot variances daily, understand patterns weekly, turn the big levers monthly.
Table of contents
- Why rhythm matters more than the number of KPIs
- The daily 5: what you need to see every morning
- The weekly comparison: spot patterns before it's too late
- Monthly controlling: read the P&L and act on it
- Model case: how an 8-location business can find its rhythm
- The 3 most common controlling mistakes
- FAQ
- Your next steps
Why rhythm matters more than the number of KPIs
Most operators I know know their KPIs. Labor cost %, food cost %, average check — the terms are familiar. The problem isn't knowledge. The problem is timing.
If you only see your labor cost % when the monthly P&L arrives, you're not steering. You're documenting. By then the numbers are 3 to 4 weeks old. You can analyse why things went badly. But you can't change anything any more.
The difference between a business that reacts and one that steers is the rhythm in which numbers arrive.
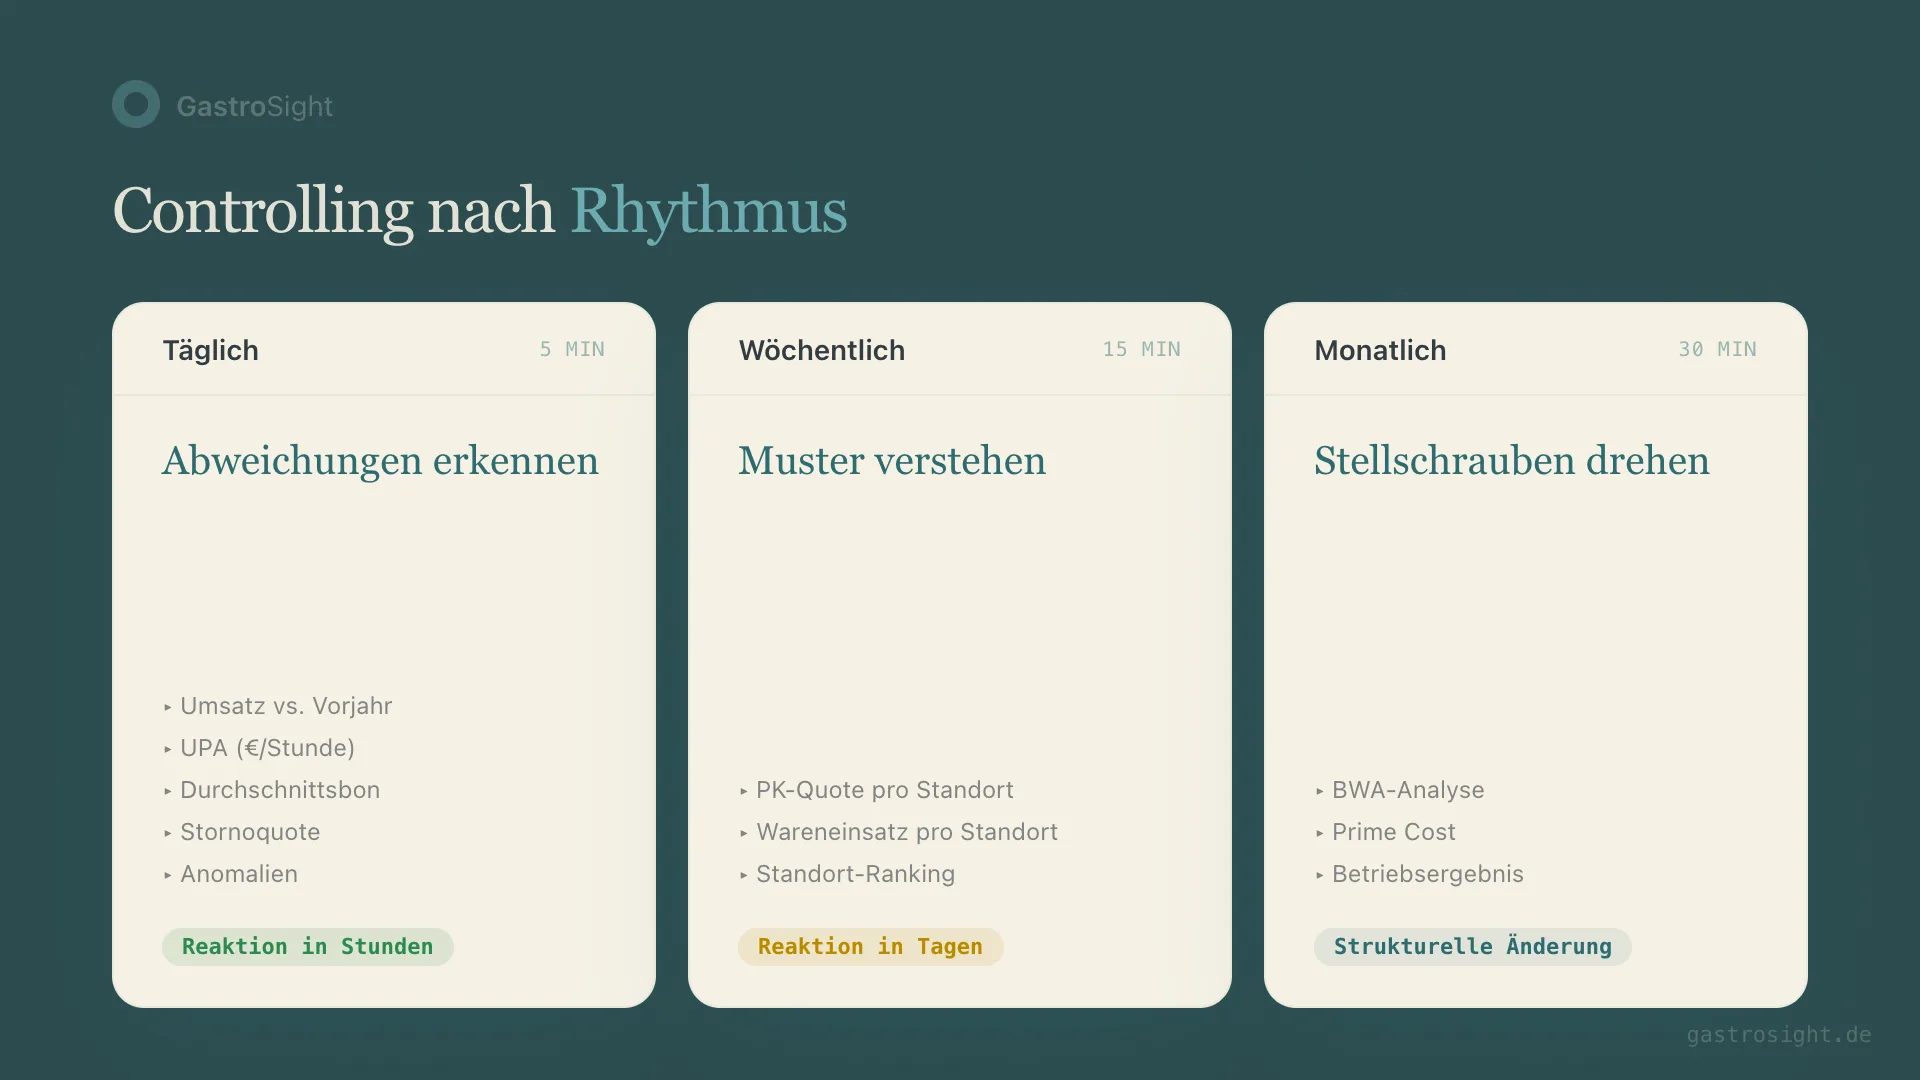
Three levels, three questions:
| Rhythm | Question | Response time |
|---|---|---|
| Daily | Is something off today? | Hours |
| Weekly | Is there a pattern? | Days |
| Monthly | Do we need to change something structurally? | Weeks |
The daily 5: what you need to see every morning
Not 20 KPIs. Five. That's all you need in the morning, as long as they're the right ones.
1. Sales vs. last year/last week
Yesterday's sales on their own say little. Information only appears in comparison. Was Monday weaker than last week? Was it the weather, a public holiday, or is a trend missing?
Always compare with the same weekday — not with the previous day. A Monday has different conditions from a Saturday.
2. Labor hours vs. sales
Absolute labor hours tell you less than their ratio to sales. 80 hours on a Tuesday with €3,000 in sales is too much. 80 hours on a Saturday with €12,000 may be too little.
The KPI for this is sales per labor hour (SPLH): net sales divided by hours worked. If the value is below your concept's benchmark, the day was overstaffed.
3. Average check
If the average check suddenly drops, it can point to several things: servers aren't upselling, a promotion is attracting the wrong guests, or the product mix is shifting.
A slow decline over weeks is more dangerous than a single weak day. That's exactly why you need the daily number — so you see the trend before it becomes a problem.
4. Void rate
Voids above 2% are a warning sign. Either something is wrong at the till (operating errors), in the kitchen (complaints) or in the process (wrong orders). The void rate is one of the most underrated daily KPIs.
5. Variances and anomalies
Anything that deviates from the expected pattern. A location suddenly 20% below plan. Food cost spiking on a single day. You need these signals in the morning, not at month-end.
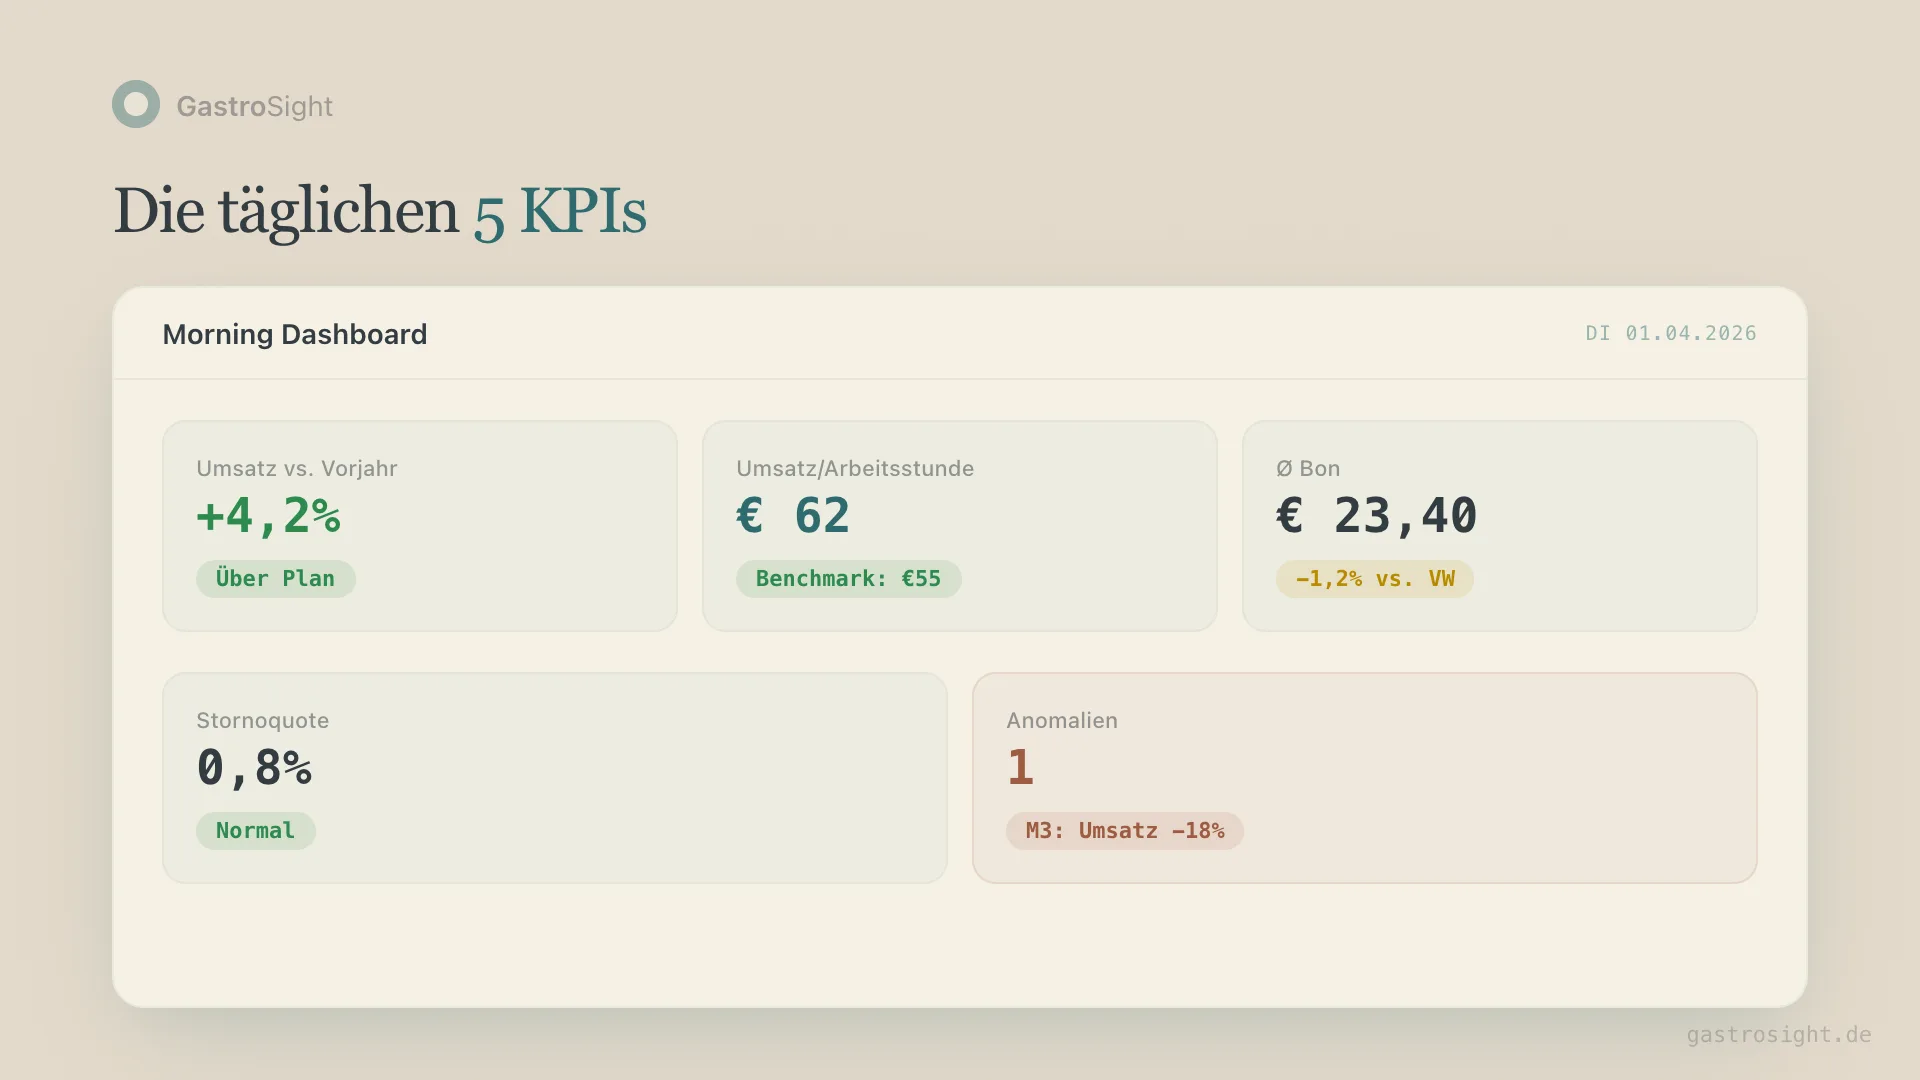
How long should this take?
Five minutes at most. If it takes you longer than 5 minutes in the morning to get an overview of every location's daily performance, something is wrong with your setup. Either the data is spread across too many systems, or nobody has prepared it.
The weekly comparison: spot patterns before it's too late
Daily numbers show variances. Weekly comparisons show patterns. And patterns are what you build your decisions on.
Labor cost % per location
The labor cost percentage isn't a monthly number. If you track it weekly, you see which locations plan well and which don't.
A location at 32% labor cost one week and 28% the next doesn't have a staffing problem. It has a planning problem. Staffing isn't reacting to swings in sales.
Food cost % per location
Same logic as labor cost. Food cost fluctuates week to week more than most people think. The question is: does it move with sales (normal) or independently of them (problem)?
Food cost that rises disproportionately as sales rise points to shrinkage, portion control or purchasing problems.
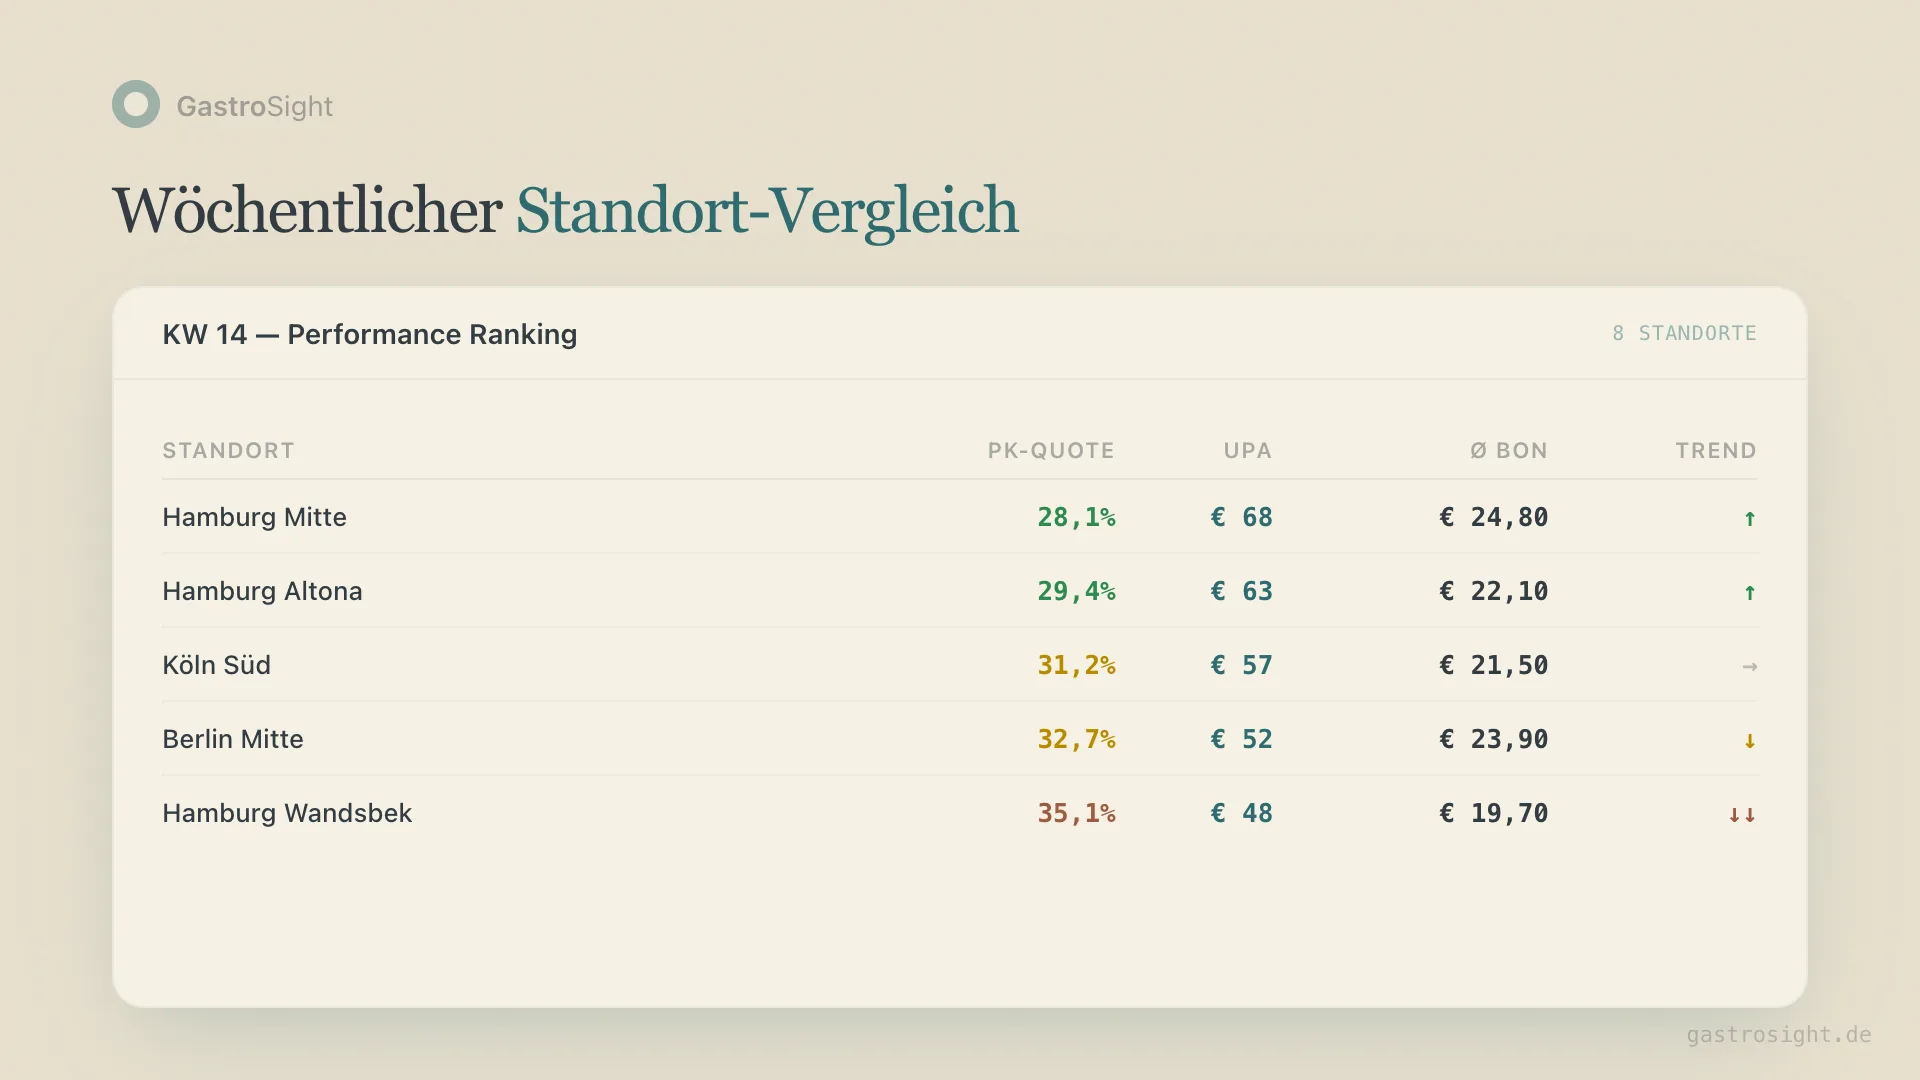
Location ranking
Which location performs best this week, which worst? Not by absolute sales — those depend on the site. By efficiency: sales per labor hour, labor cost %, average check.
The ranking shows you where to look. Not to punish anyone, but to understand what the strong locations do differently.
Monthly controlling: read the P&L and act on it
The monthly P&L comes from your accountant. Usually 3 to 4 weeks after month-end. The numbers are accurate, but old.
Even so, the P&L has its place. It shows items you can't see at a daily or weekly rhythm: rent, insurance, depreciation, interest. And it gives you the official picture of your profitability.
The 4 P&L lines operators should look at first
| Line | What it shows | Reference value |
|---|---|---|
| Labor cost | Total labor cost % | Your own trend per location (German federal statistics, 2024: 32.8% in restaurants, bars, takeaways and cafés) |
| Cost of goods sold | Food and beverage cost | Guide value 25–32% depending on concept (no official statistic) |
| Prime cost (labor + goods) | The two largest cost blocks combined | Below 60% |
| Operating profit | What's left at the end | 8–15% |
Prime cost as the monthly target
If you have to pick one number from the P&L as your steering metric: prime cost. Labor cost plus cost of goods, divided by net sales.
Below 60%, your business is on a good course. Above 65%, too little is left for rent, investment and profit. Between 60% and 65% you need to act, but it isn't an emergency.
The P&L tells you whether your month was profitable. Daily and weekly numbers tell you whether next month will be too. How much sales you need at minimum to cover your fixed costs you can work out with the break-even calculator.
Model case: how an 8-location business can find its rhythm
Take a model business (not a real case): a casual dining concept with 8 locations and €12 million in annual sales. Controlling consists of a monthly P&L review with the accountant and an Excel sheet the managing director fills with POS data every morning.
The starting point
- No daily reporting across all locations
- Labor cost % known, but only as a monthly figure
- Variances only become visible in the P&L review
- No location ranking, no systematic comparison
- Gathering the numbers eats time every morning
What can change in 3 months
Weeks 1–2: A daily dashboard with the 5 KPIs replaces the manual compilation. Not because less gets analysed, but because nobody has to collect the data by hand any more.
Weeks 3–4: Weekly labor cost % per location becomes visible. Typical pattern: individual locations sit systematically above the rest because fixed weekly schedules don't react to daily sales.
Months 2–3: Roll out sales-based scheduling and measure labor cost % over comparable periods. Only report a change as a result once implementation is documented.
Model calculation: 2.3 percentage points on €12 million in sales would be €276,000 in profit per year.
The meeting with the accountant still happens. But now it's a confirmation, not a surprise.
The 3 most common controlling mistakes
Mistake 1: Too many KPIs at once. Looking at 20 KPIs in the morning achieves less than looking at the right 5. If you track everything, you recognise no patterns. Start with the daily 5 and build from there.
Mistake 2: Data without comparison. Sales of €8,000 say nothing. €8,000 versus €10,000 in the same week last year says everything. Every number needs context: last year, last week, plan or benchmark.
Mistake 3: Controlling as coming to terms with the past. If you only look at numbers to explain what went wrong, you're not steering. You're documenting. Controlling has to look forward: what do I need to do differently this week?
Everything on Controlling and finance
- Restaurant Business Intelligence: Data Instead of Gut Feel
- Restaurant Daily Report: What Belongs in It and Why
- AI in Restaurants 2026: What Actually Works
- Claude AI for Restaurants: Analyse Your Numbers, 10 Questions
- Analyze Restaurant POS Data with ChatGPT: CSV vs. Plugin
- Restaurant Cash Flow Forecast: 13 Weeks Instead of Your Bank Balance
- Restaurant Invoice Automation: Capturing and Checking Supplier Invoices
Related on kiosa.ai:
From analysis to action
What this is about: the daily, weekly and monthly management rhythm.
Put it into practice: Operational cockpit Kiosa One View
FAQ
Which KPIs matter most in restaurant financial controlling?
Daily: sales vs. last year, sales per labor hour, average check, void rate and anomalies. Weekly: labor cost % and food cost % per location. Monthly: prime cost and operating profit from the P&L. The selection depends on the type of concept, but these 9 KPIs cover 80% of what you need to steer.
How often should I look at my numbers?
Five minutes a day for the daily KPIs. Fifteen minutes a week for the location comparison. Thirty minutes a month for the P&L analysis. If you need more time than that, you have a tooling problem, not a controlling problem.
Is a monthly P&L enough for good controlling?
No. The P&L shows the past with a 3–4 week delay. For operational steering you need daily and weekly data from your POS and labor planning. The P&L completes the monthly picture, but it doesn't replace operational controlling.
What does a controlling dashboard for restaurants cost?
The range goes from free Excel templates to professional BI tools. Professional restaurant dashboards typically cost €100 to €200 per location per month. The question isn't whether you can afford a dashboard. The question is whether you want to keep paying for 45 minutes of manual work every morning.
Do I need a dashboard from the first location?
From the first location you need a system. That can be Excel. From 3 locations, Excel becomes impractical. From 5 locations, an automated dashboard isn't a luxury but a precondition for keeping the overview.
Your next steps
Labor cost calculator — Calculate your real labor cost percentage including all employer costs. The most common mistake: using gross wages only.
Kiosa AI plugin — Ask Claude or ChatGPT about the numbers you see for your business in Kiosa.
Restaurant labor cost percentage — Our in-depth article on calculating it, benchmarking it and 5 levers to improve it.
15 minutes well spent. Want to see what same-day controlling looks like for your locations? Write to me — I'll show you on real data.
Sources
- Statistisches Bundesamt (German Federal Statistical Office) — Hospitality — sales and employment data for the German hospitality sector
Related terms
- Labor cost ratio — labor cost relative to sales
- Food cost ratio — cost of goods relative to sales
- Contribution margin — sales minus variable costs as a daily steering metric
