Today's bank balance tells you nothing about whether you'll be able to pay your payroll contributions in five weeks. A rolling 13-week cash flow forecast does: it lays planned receipts and payments on top of each other week by week and shows you a shortfall before it happens, not once it's already there. For restaurants with thin margins, that's the difference between steering and reacting. The forecast looks ahead; what actually happened is shown by the monthly P&L and the daily and weekly numbers from restaurant financial controlling.
In Germany, around 2,900 hospitality businesses became insolvent in 2025, almost 30 percent more than the year before (Creditreform, hospitality sector analysis, published 12 May 2026, accessed 7 September 2026). Almost 40 percent of German hospitality businesses have an equity ratio below 10 percent, and around a third are loss-making. With that little capital, a single badly timed month is enough to slide into insolvency — not because the business doesn't work, but because a payment fell due while the account was empty. AI doesn't replace this planning, but it keeps it up to date without you rebuilding it by hand every week.
This article shows how a rolling 13-week forecast is built, which outflows are fixed in a restaurant and how it differs from the monthly P&L and plain sales analysis.
Table of contents
- What is a rolling 13-week cash flow forecast?
- Why looking at your bank balance comes too late
- Cash flow forecast vs. P&L: looking ahead instead of back
- Which restaurant outflows are fixed — and which are variable
- How to build your rolling 13-week forecast
- Worked example: 13 weeks at Trattoria Musterberg
- How an AI-supported forecast sharpens the outlook
- FAQ
- Your next steps
What is a rolling 13-week cash flow forecast?
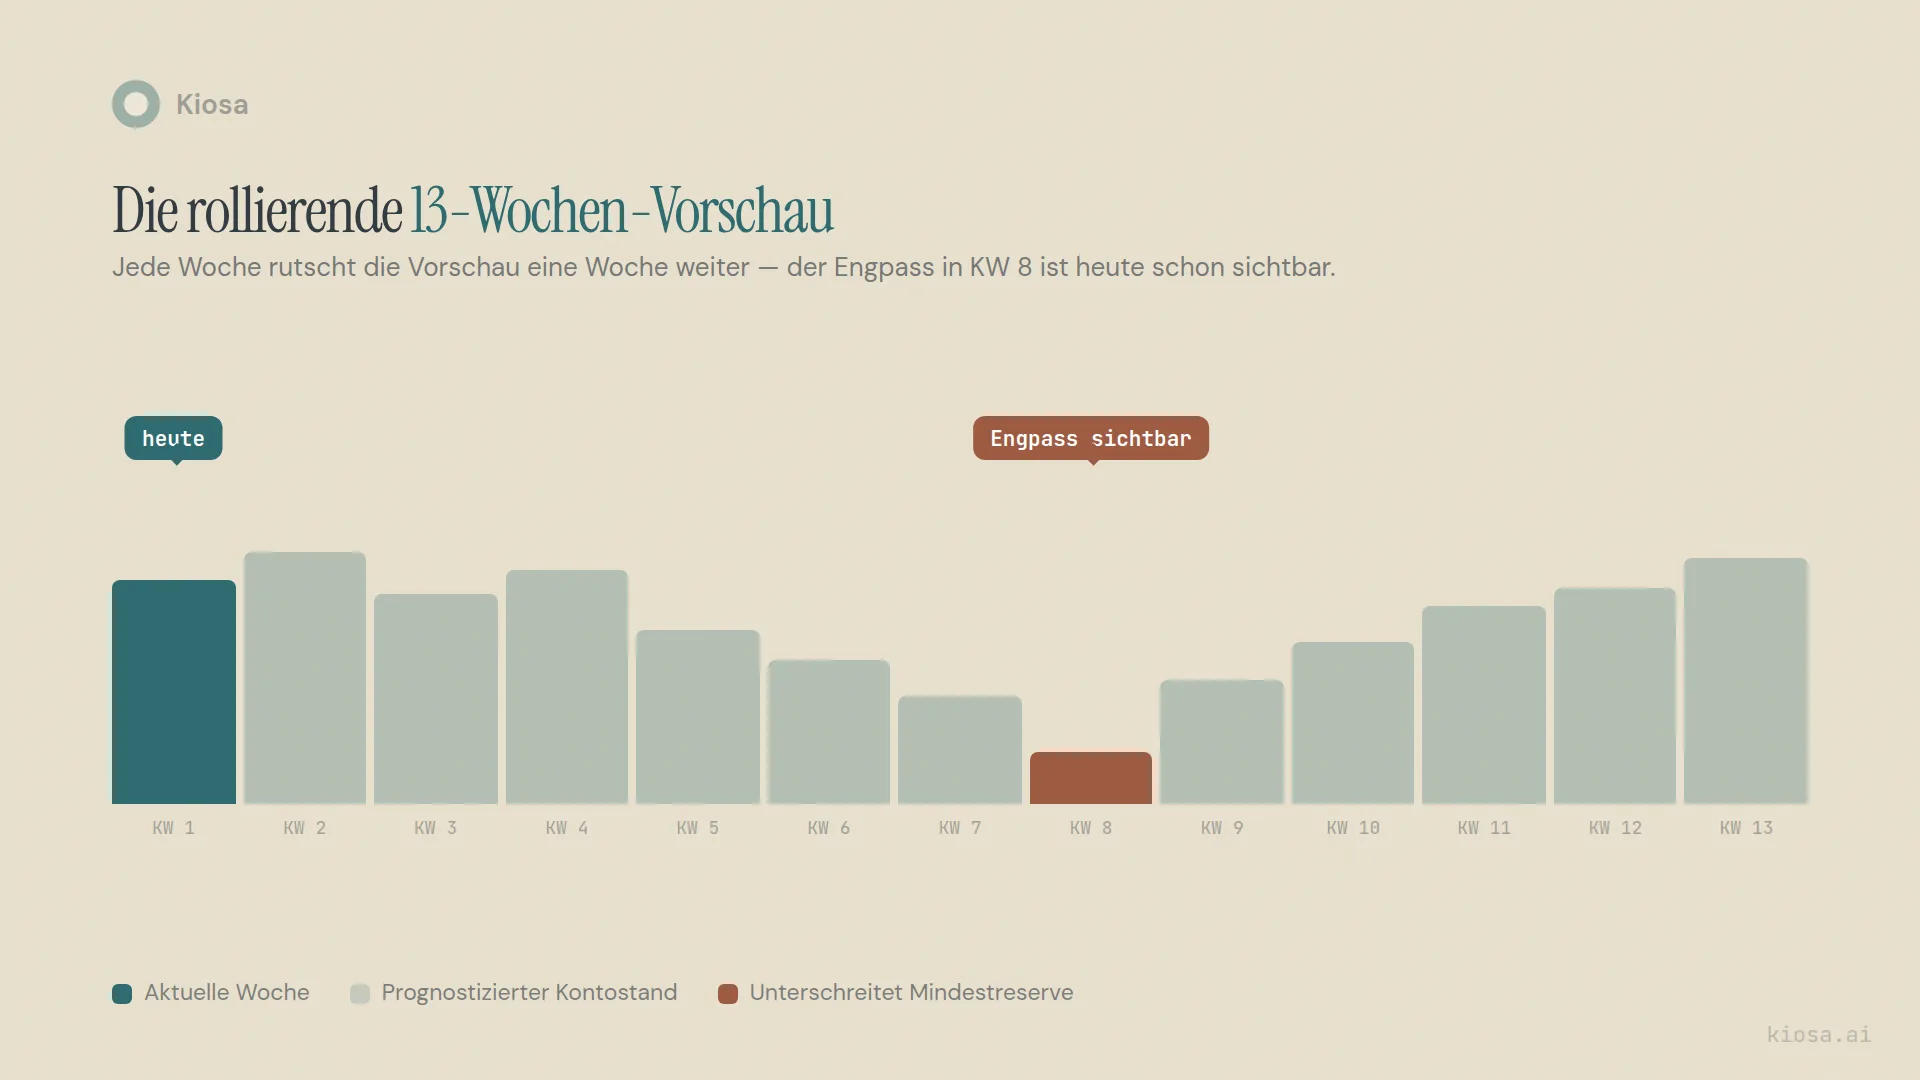
A 13-week cash flow forecast lists all expected receipts and payments for the next 13 weeks, accumulates them into a weekly bank balance and compares that against a minimum reserve. "Rolling" means: every week the oldest week drops off the back and a new week is added at the front. The planning horizon always stays 13 weeks long; only the actual weeks move along with the calendar.
13 weeks isn't an arbitrary value. The window is long enough to cover a full quarter with its typical due dates (sales tax or VAT payments, payroll contributions, quarterly bills from energy providers and suppliers), and short enough to stay reliable. A twelve-month forecast for a restaurant with volatile daily business is little more than hope. A 13-week forecast rests on numbers you mostly already know: confirmed bookings, running contracts, known payment dates.
Prime cost — food cost plus labor cost — determines how much buffer is created between receipts and fixed costs in the first place. A cash flow forecast doesn't replace this KPI; it translates it into a calendar: when exactly does a good margin become a bank balance that covers a bill — and when doesn't it?
Why looking at your bank balance comes too late
The most common mistake I see in multi-location businesses: cash is measured by today's bank balance, not by what falls due over the next few weeks. An account with €20,000 looks comfortable — until at month-end the payroll contributions, the sales tax payment and two large supplier invoices fall on the same day and together cost more than is in the account.
That's not an exception but a collision on a fixed schedule. Payroll contributions and sales tax payments have statutory due dates that depend on your country, but they sit firmly in the calendar, regardless of how business went that week.
If you only look at your bank balance, you see this collision on the due date, when the cover isn't enough. If you plan 13 weeks ahead, you see it now: invoice earlier, move a payment, agree longer payment terms with a supplier. The difference is the lead time you have to react.
Cash flow forecast vs. P&L: looking ahead instead of back
The monthly P&L answers a different question from the cash flow forecast, and playing the two numbers off against each other is misleading. The P&L shows you whether a past month was profitable — sales, food cost, gross profit, labor cost, provisional result, usually four to six weeks after month-end. That's the income statement: clean from an accounting point of view, but structurally late.
The 13-week cash flow forecast answers whether you'll stay solvent — regardless of whether the month was profitable. A business can be profitable and still get into a cash squeeze if receipts and due bills fall apart in time. And a business can have a weak month and still stay liquid if it has built up enough reserve. Profitability and solvency are two different questions that need two different tools.
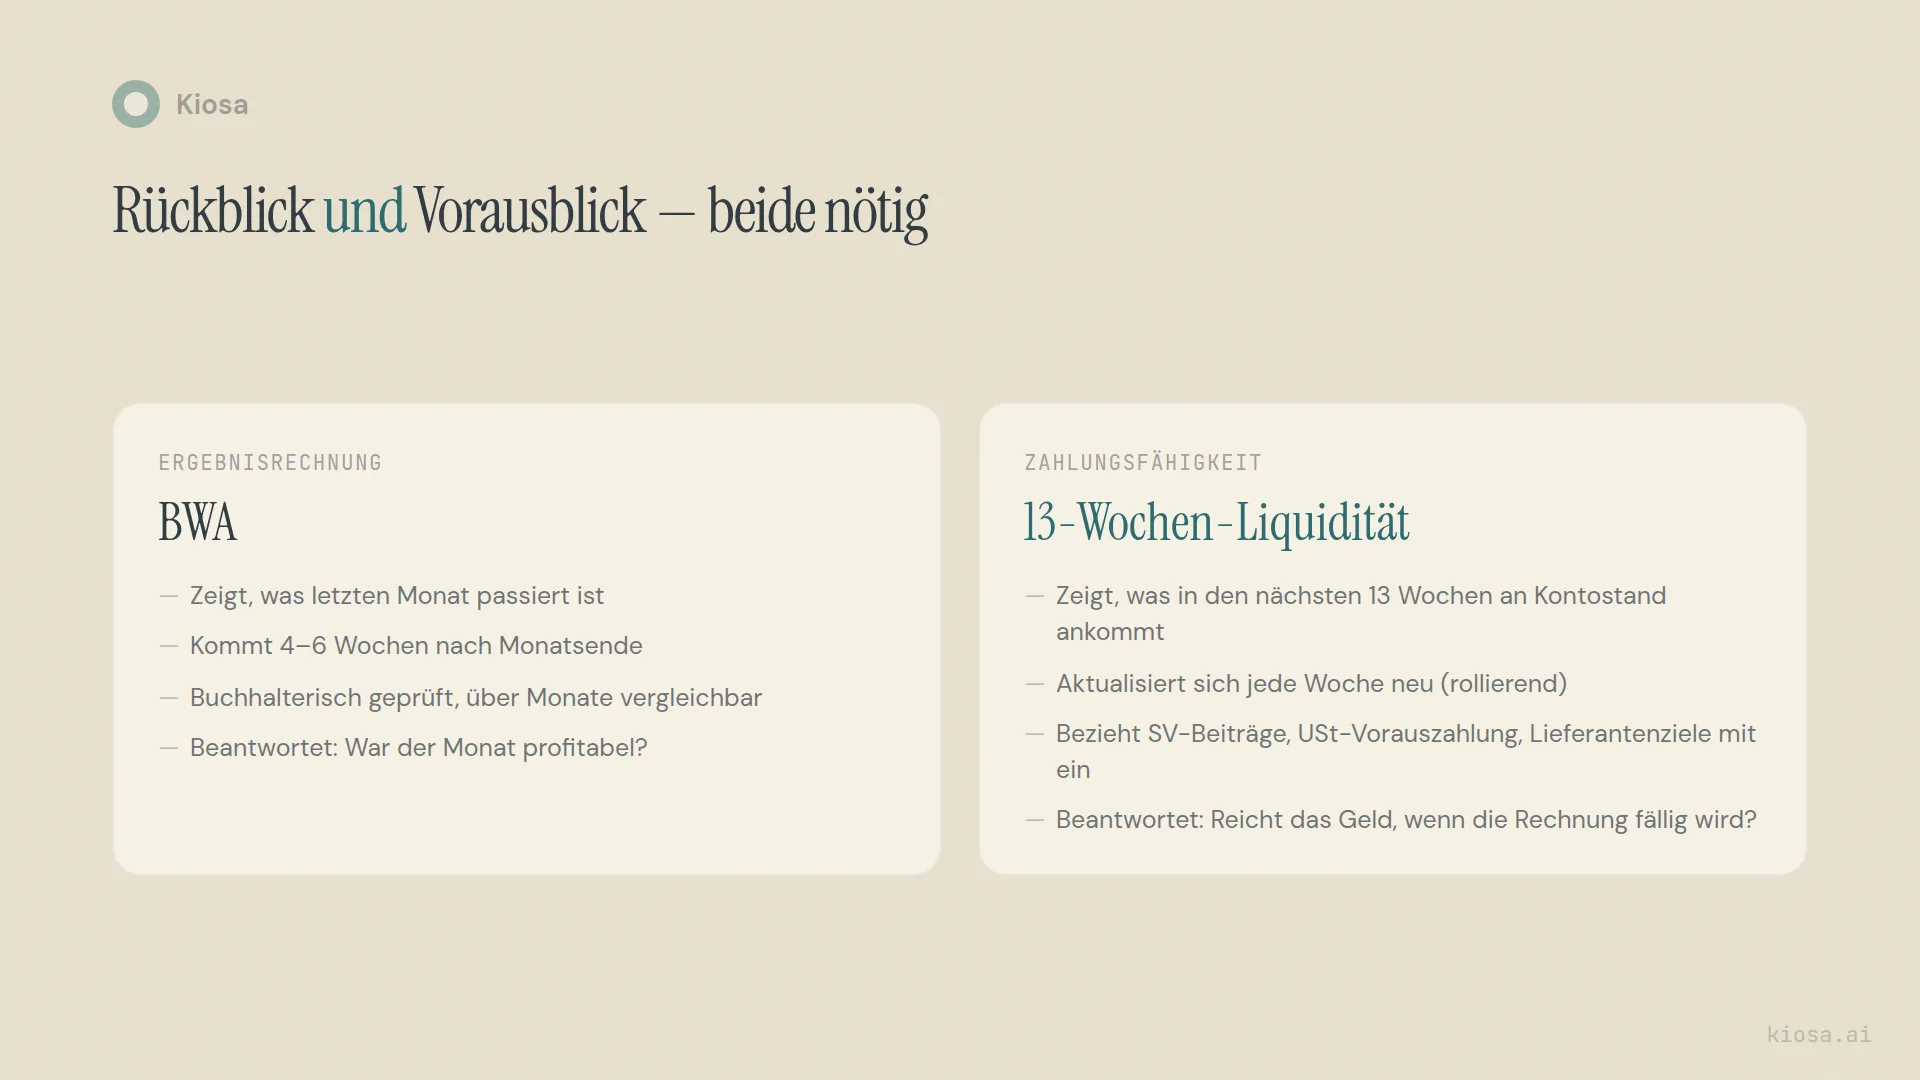
The two tools complement each other best when they sit on the same data. A same-day P&L from POS and accounting provides both the monthly reconciliation and the weekly numbers for the cash flow forecast — two views of the same business, not two separate Excel sheets you painstakingly keep in sync. How a drop in sales affects both views is shown in the article on why restaurant sales are dropping: a decline at one location or in one product group shifts the cash flow forecast first, often weeks before it shows up in the P&L.
Which restaurant outflows are fixed — and which are variable
A reliable 13-week forecast first separates what can't be negotiated from what has room for manoeuvre. Four categories of fixed outflows appear in practically every restaurant:
Payroll contributions. Due on a statutory date, and late payment usually carries penalties. For businesses with a high labor cost percentage, this is one of the largest single monthly items of all.
Sales tax or VAT payments. Due on a fixed date after the end of the reporting period, monthly or quarterly depending on your situation. The exact dates depend on your country's rules.
Rent and fixed costs. Usually due on the first of the month, plannable to the day, but often the largest single item after labor and food cost.
Supplier invoices with payment terms. This is where most of the room for manoeuvre lies: if you know your payment terms and actively manage them, you can spread payments over time without straining the relationship with the supplier.
On the receipts side it's the other way round: daily sales from the POS are the most variable figure in the whole model — seasonal, weekday-dependent and weather-dependent. That's exactly why it pays to record fixed outflows as precisely as possible — they're the part of the equation you can control, while sales can only be estimated.
How to build your rolling 13-week forecast
The setup follows four steps that are then repeated every week:
1. Set the opening balance. The actual bank balance on the reference date, not a rounded guide value. Any inaccuracy here distorts all 13 following weeks.
2. Enter fixed outflows. Payroll contributions, sales tax payments, rent, loan repayments, lease payments, insurance — everything with a known date and a known amount goes into the relevant week.
3. Estimate variable items. Food cost based on planned orders, labor cost based on the schedule, sales based on year-on-year comparison and known special factors such as public holidays or bookings.
4. Define a minimum reserve and check against it. A buffer line that should never be crossed — for example two to four weeks of running fixed costs, a rule of thumb, not a standard. Every week in which the forecast balance falls below this line is an early warning, not a surprise.
Then the real work begins: every week the oldest week is replaced by actual figures, a new week 13 weeks in the future is added, and the estimates for the remaining weeks are sharpened with more current information. By hand, that's doable for a single location. For several locations with different payment dates and supplier contracts, it quickly becomes Excel upkeep that nobody does consistently every week — and a cash flow forecast that's only updated every few months is hardly better than none.
Worked example: 13 weeks at Trattoria Musterberg
Take a fictitious model restaurant, Trattoria Musterberg, with an opening balance of €18,400 in week 5. The example is entirely made up and serves only as an illustration, not real business figures:
| Week | Opening balance | Receipts | Payments | Closing balance |
|---|---|---|---|---|
| Week 5 | €18,400 | €21,000 | €17,600 | €21,800 |
| Week 6 | €21,800 | €19,500 | €21,200 | €20,100 |
| Week 7 (payroll contributions due) | €20,100 | €18,800 | €29,400 | €9,500 |
| Week 8 (sales tax payment due) | €9,500 | €17,200 | €24,600 | €2,100 |
| Week 9 | €2,100 | €22,400 | €18,900 | €5,600 |
Trattoria Musterberg's minimum reserve is €8,000. In week 8 the forecast balance falls well below that line, to €2,100. Without a 13-week forecast, this shortfall would only become visible in week 8 itself, when the sales tax payment is already due and the account runs dry. With the forecast it's visible in week 5, three weeks in advance — enough time to bring forward an outgoing invoice, move a supplier payment by a week or sort out an overdraft facility in good time instead of negotiating it on the spot in an emergency.
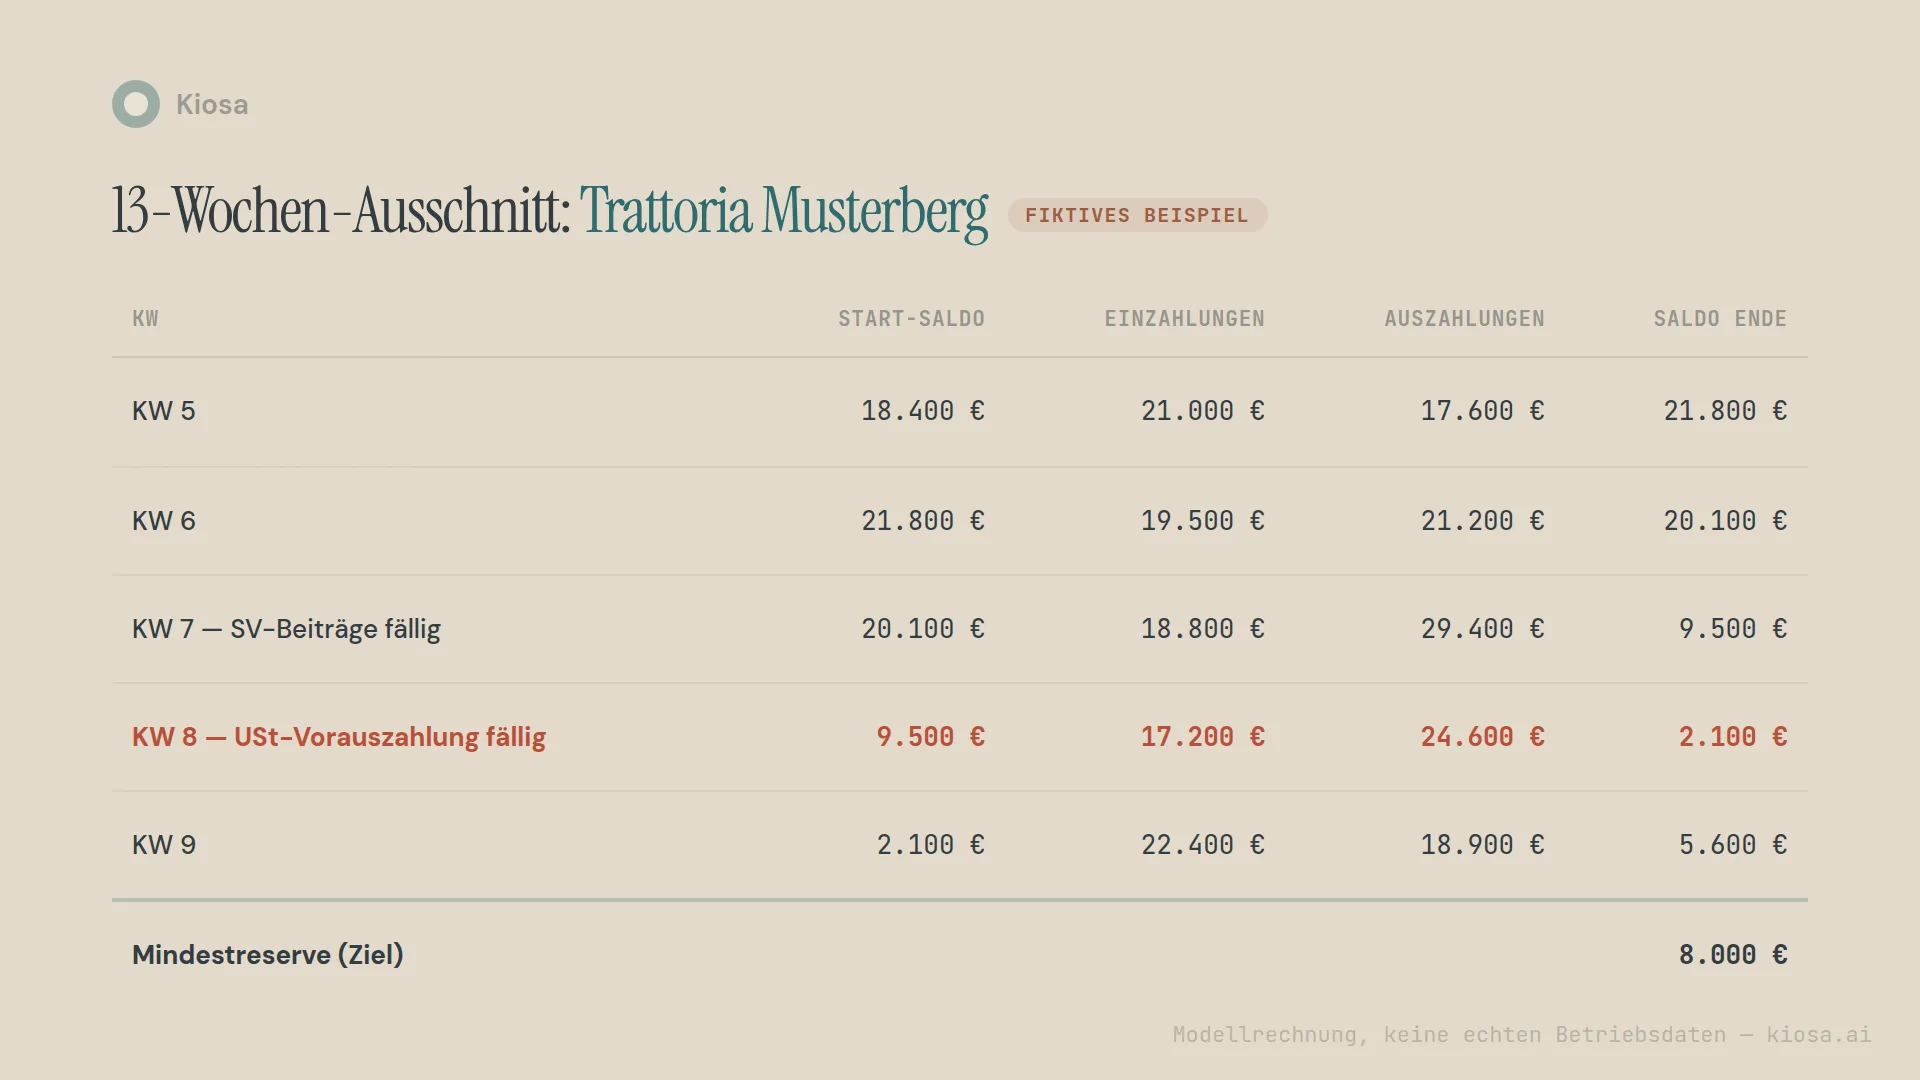
The point of this model isn't the specific figure of €2,100. The point is the distance between spotting and happening: three weeks instead of zero.
How an AI-supported forecast sharpens the outlook
Maintaining the four setup steps by hand is doable for one location over a few weeks. For several locations over a full quarter, the upkeep quickly becomes a side task that gets left — and an outdated cash flow forecast protects against nothing.
Kiosa keeps the basis for it continuously up to date instead of capturing it once. One View provides the same-day P&L, so food cost and labor cost aren't estimated but rolled forward from real actual data. The Invoices module brings the cash cockpit with a 13-week cash flow forecast: bank balance, upcoming debits and outstanding receipts come together, and a shortfall alert arrives before it reaches your account. The sales forecast is calculated per location. For the receipts side of the 13-week forecast, that's the difference between a rough estimate and a number calibrated against your own history.
Public holidays and local events feed into the forecast instead of being treated as outliers. An Easter Sunday or a city festival affects expected sales differently from an ordinary week, and that's exactly what the forecast should reflect.
The limit still matters: the forecast provides the most likely number for sales and food cost, not a guarantee. How much minimum reserve you plan for and how you react to a shortfall you've spotted remains your decision. The software shortens the time to insight, not the responsibility for the response.
Kiosa pricing is modular, per location per month, with no setup fee:
| Module | Price/location/month |
|---|---|
| One View (dashboard, same-day P&L, forecast, morning briefing) | €99 |
| + Inventory | €49 |
| + Invoices (documents, accounting export, cash cockpit) | €99 |
| + Loyalty | €99 |
| + Scheduling | €99 |
| Fully built out | €445 |
For cash flow planning, the Invoices module is the central building block: it provides the cash cockpit with the cash flow forecast, while One View supplies the same-day P&L and the sales forecast the 13-week outlook builds on. One View brings together the view across all locations, so a shortfall at one location doesn't get lost in the total. All details are on the pricing page.
From analysis to action
What this is about: building a rolling 13-week cash flow forecast and spotting shortfalls early.
Put it into practice: Liquidity cockpit in Kiosa Invoices
More on Controlling and finance
- Restaurant Financial Controlling: What to Measure Daily, Weekly and Monthly
- Restaurant Invoice Automation: Capturing and Checking Supplier Invoices
FAQ
What is a rolling 13-week cash flow forecast?
A 13-week cash flow forecast lists all expected receipts and payments for the next 13 weeks and calculates the weekly bank balance from them. "Rolling" means the window moves every week: the oldest week drops off and a new week in the future is added. That keeps the planning horizon permanently at 13 weeks.
Why exactly 13 weeks and not 12 months or 4 weeks?
13 weeks correspond to a quarter and so cover the typical quarterly due dates, such as sales tax payments or quarterly bills. The period is long enough to spot such dates early and short enough for the estimates to stay reliable. A twelve-month forecast would be little more than hope for the volatile daily business of a restaurant.
How is a cash flow forecast different from the P&L?
The P&L shows in retrospect whether a past month was profitable, usually with a four-to-six-week delay. The cash flow forecast shows in advance whether you'll stay solvent over the coming weeks. A business can be profitable and still get into a cash squeeze if receipts and payments fall apart in time — so one doesn't replace the other.
Which payment dates should I enter in the cash flow forecast first?
Start with the statutory dates that leave no room for negotiation: payroll contributions and sales tax or VAT payments, on the due dates that apply in your country. Then rent and fixed costs, and finally supplier invoices with payment terms, because that's where most of the room for manoeuvre lies.
Can software create the cash flow forecast automatically?
Software can keep the data basis up to date automatically: a same-day P&L instead of a delayed monthly report, and a sales forecast calibrated against each location's history. Setting the minimum reserve and deciding how to react to a shortfall you've spotted remain business decisions that the software prepares but doesn't make.
Your next steps
Do you know whether your bank balance in eight weeks will cover a sales tax payment and your payroll contributions at the same time — or will you only look once both are about to be debited?
P&L analyzer — See how your cost blocks currently relate to each other, as a starting point for the fixed outflows in your own 13-week forecast.
Related article: Why restaurant sales are dropping: find the cause instead of guessing
30 minutes well spent. Want to see your next 13 weeks as numbers rather than gut feeling? Book a demo call — I'll show you on real data what the rolling forecast looks like in the dashboard.
Related terms
- Prime cost — food cost and labor cost combined as a steering KPI, the basis of every cash estimate
