Your POS system stores much more than sales with every check: items, timestamps, payment method, voided and discounted lines, often the server and table too. If you only read off daily sales, you're using a fraction of it. Analysing POS data means calculating average check, the best-seller/poor-performer ratio, void and discount rate and time patterns — and building controlling and forecasting on top. The POS alone doesn't close the most expensive gap, though: food cost control.
Most restaurants I know open their POS system once a day. They look at one number: sales. Sometimes also the split by payment method, because bookkeeping needs it. The rest of the database goes unused — not because the data is missing, but because nobody pulls it.
That's not a criticism. A POS system is built to process payments, not as a reporting tool. Even so, every check contains a lot of structure that a few formulas can turn into real steering metrics. This article shows which fields those are, how to calculate them — and where the POS stops, so that controlling and forecasting have to take over.
Table of contents
- What's really in every POS check?
- Which KPIs can you calculate from POS data?
- What do time of day and weekday show in POS data?
- Where does the POS stop?
- How does POS data become a forecast?
- What mistake do most restaurants make when analysing POS data?
- FAQ
- Your next steps
What's really in every POS check?
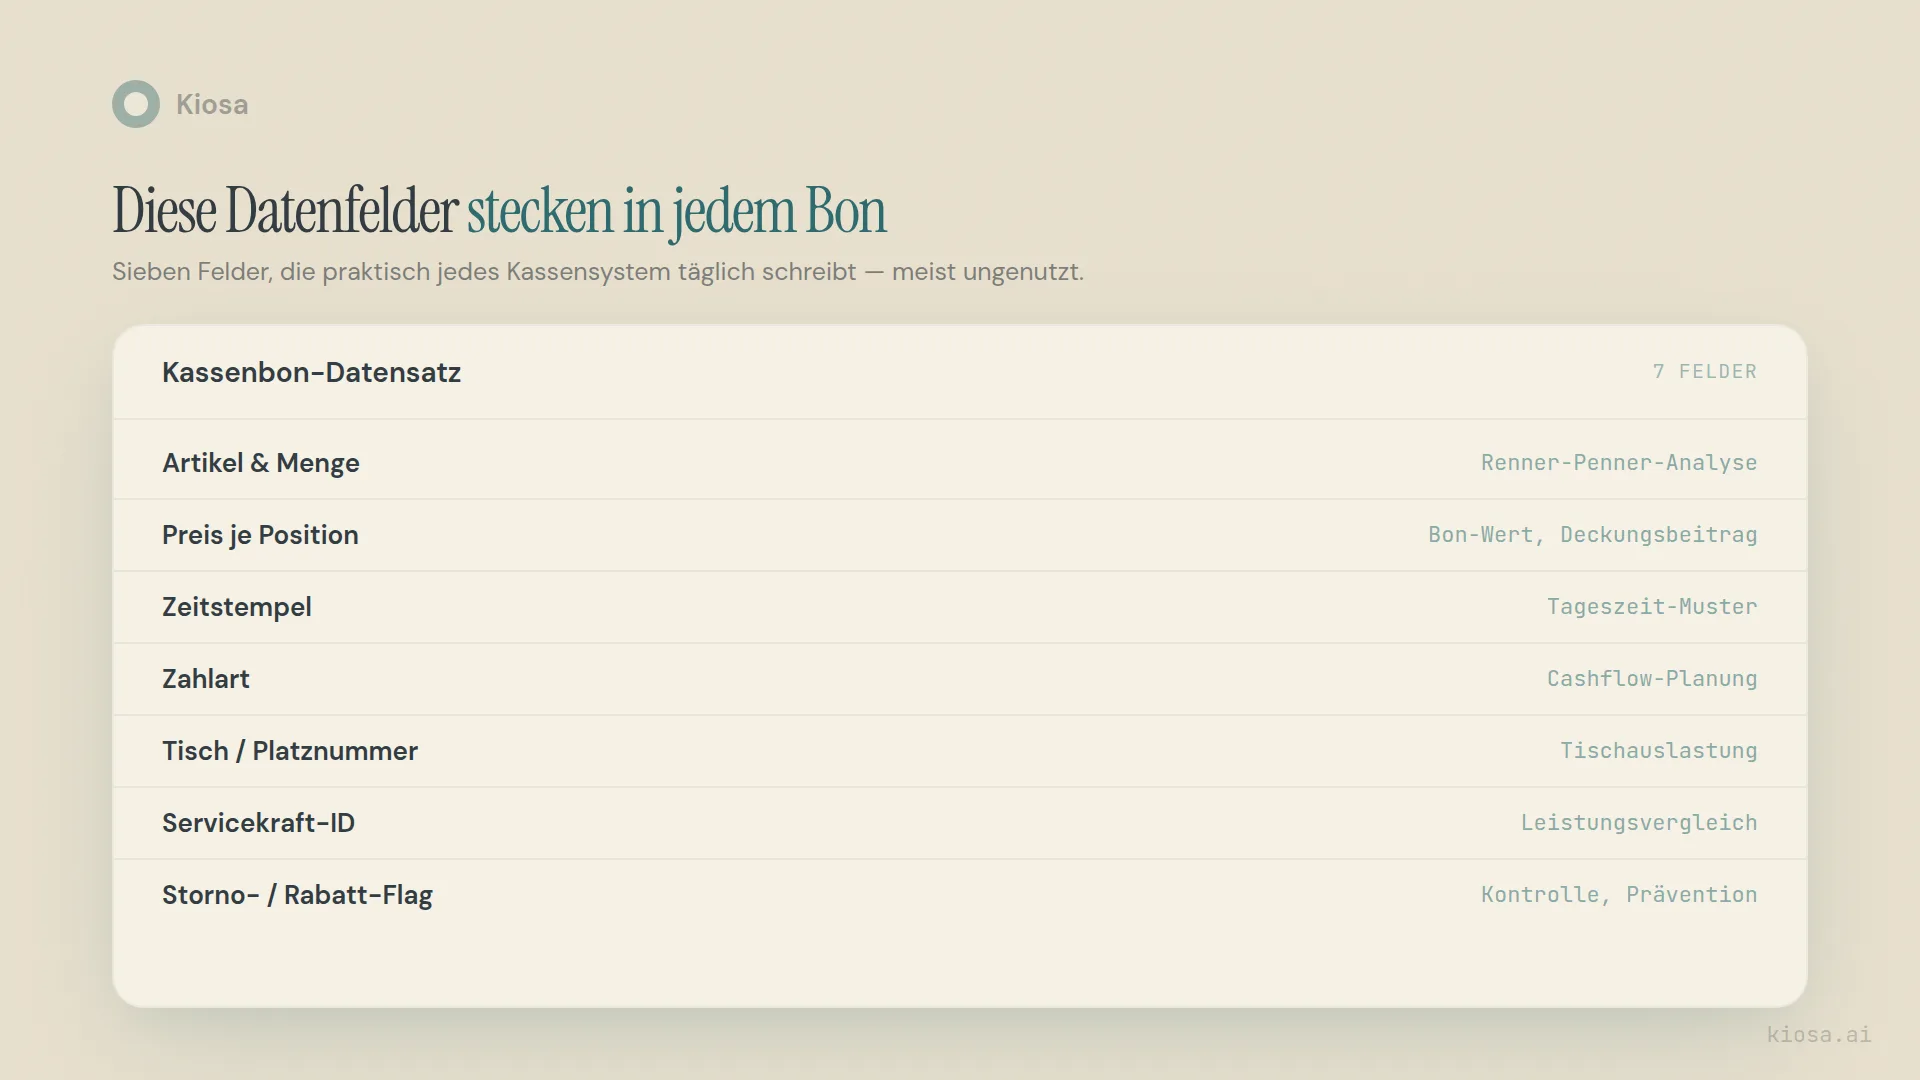
Every check your POS system prints is a record with several fields — not just a total. Names differ from system to system, but the structure is similar in almost every modern POS:
| Data field | What it shows | What it's for in controlling |
|---|---|---|
| Item & quantity | What was sold, and how many | Menu item sales analysis, menu optimisation |
| Price per line | Selling price per item | Average check, contribution margin |
| Timestamp | Time the check was opened and closed | Time-of-day patterns, staff deployment |
| Payment method | Cash, card, voucher, invoice | Cash flow planning, tip allocation |
| Table/seat number | Which table ordered | Table utilization, seating time |
| Server ID | Who rang up the check | Performance comparison within the team |
| Void/discount flag | Whether and why a line was voided or reduced | Control, fraud prevention |
Seven fields that sit in practically every check. Most POS systems even export them as CSV or via an API — but hardly anyone looks at them systematically, because the POS interface itself isn't built for that. It shows you daily reports, not patterns across weeks and locations.
Which KPIs can you calculate from POS data?
From the seven fields above you can derive four KPIs that tell you more for daily steering than plain daily sales.
Average check. Daily sales divided by the number of checks. Shows whether guests are spending more or less than usual on average — regardless of whether more or fewer guests came. A falling average check with stable guest numbers is a different problem from a stable average check with falling guest numbers. The POS only shows you the total. You have to make the split yourself.
Best-seller/poor-performer ratio. Which items sell often and at what contribution margin, and which are only on the menu because they've always been there. For this you need item quantities from the POS and food cost per item from your costing — the POS alone only gives you half the calculation.
Void/discount rate. The number of voided or discounted lines divided by total lines. A rate that suddenly rises above its usual level is one of the most reliable early warning signs of operating errors or irregularities at the till — visible well before month-end if you look daily rather than once a month.
Sales per available seat. Daily sales divided by the number of seats — the metric that lets you compare locations of different sizes at all, rather than comparing apples with oranges.
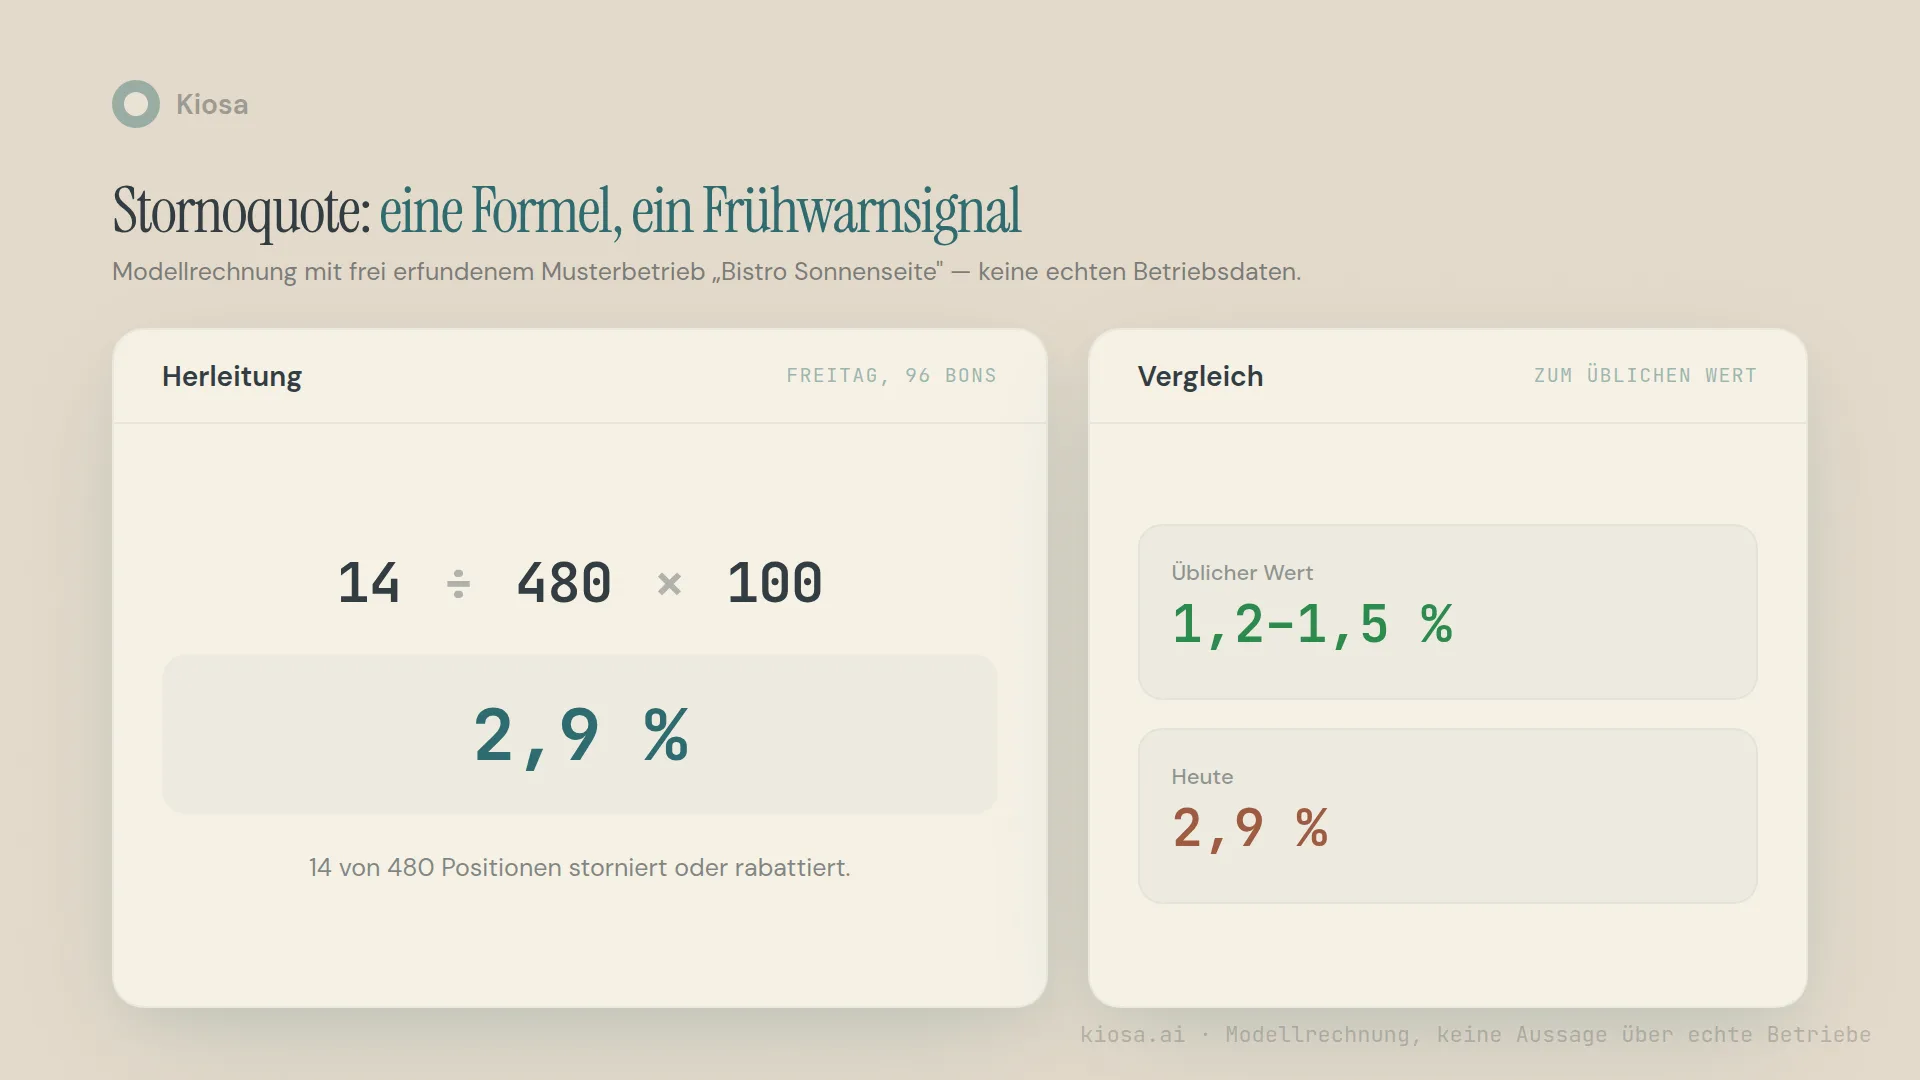
A worked example, purely for illustration with an entirely made-up model business: "Bistro Sonnenseite" rings up 480 lines on 96 checks on a Friday. 14 of those lines are voided or discounted.
Void rate = 14 ÷ 480 × 100 = 2.9%
If this model business's usual value is 1.2 to 1.5 percent, that's a spike that deserves a second look — before it settles in as a trend over the next few weeks.
What do time of day and weekday show in POS data?
The timestamp is the most underrated field on the check. It answers three questions that are directly relevant to labor and food cost planning:
- When are most checks opened — and does that match your shift schedule?
- Which weekday brings which average check? A Saturday evening with a high average check needs different capacity from a Tuesday lunchtime with a low one.
- How long does a sitting last on average from opening to closing the check, broken down by time of day? That's the basis for table utilization.
These patterns aren't reliable from individual days. A single Tuesday says little. Only over six to eight weeks do the timestamps turn into a robust pattern you can use to plan staffing and purchasing instead of going by feel.
Before you analyse POS data, there's the end-of-day close. A daily close checklist for restaurants helps make sure cash, payment methods and voids are right.
Where does the POS stop?
Everything mentioned so far can be calculated from POS data alone. What you don't get in the POS system itself:
Food cost per item. The POS knows a pasta dish was sold. It doesn't know what the ingredients for that portion cost. For the food cost ratio you need recipe costing alongside it.
Labor cost for the same shift. Labor cost is one of the largest cost blocks in any restaurant — but the figure comes from two systems that don't talk to each other in most businesses: the POS and the schedule.
The explanation for an anomaly. The POS shows you that Tuesday's sales were 18 percent below average. It doesn't tell you why. Was it the weather, a neighbouring business that closed, a server who called in sick, a wrongly configured promotion? That's the job of anomaly detection — a comparison against the expected pattern, not against the previous day.
A forecast. The POS is a rear-view mirror. It shows what happened. To answer how many guests to expect next Saturday, you need a model that combines historical POS data with seasonal patterns and special events.
That's not a weakness of the POS — it's simply outside what it's built for. A POS system processes payments reliably. Controlling and forecasting need a layer on top that connects POS data with food cost, labor and bookkeeping.
How does POS data become a forecast?
AI comes in at this last step: a forecasting model learns from historical check data which patterns repeat and uses them to propose a sales forecast for the coming days.
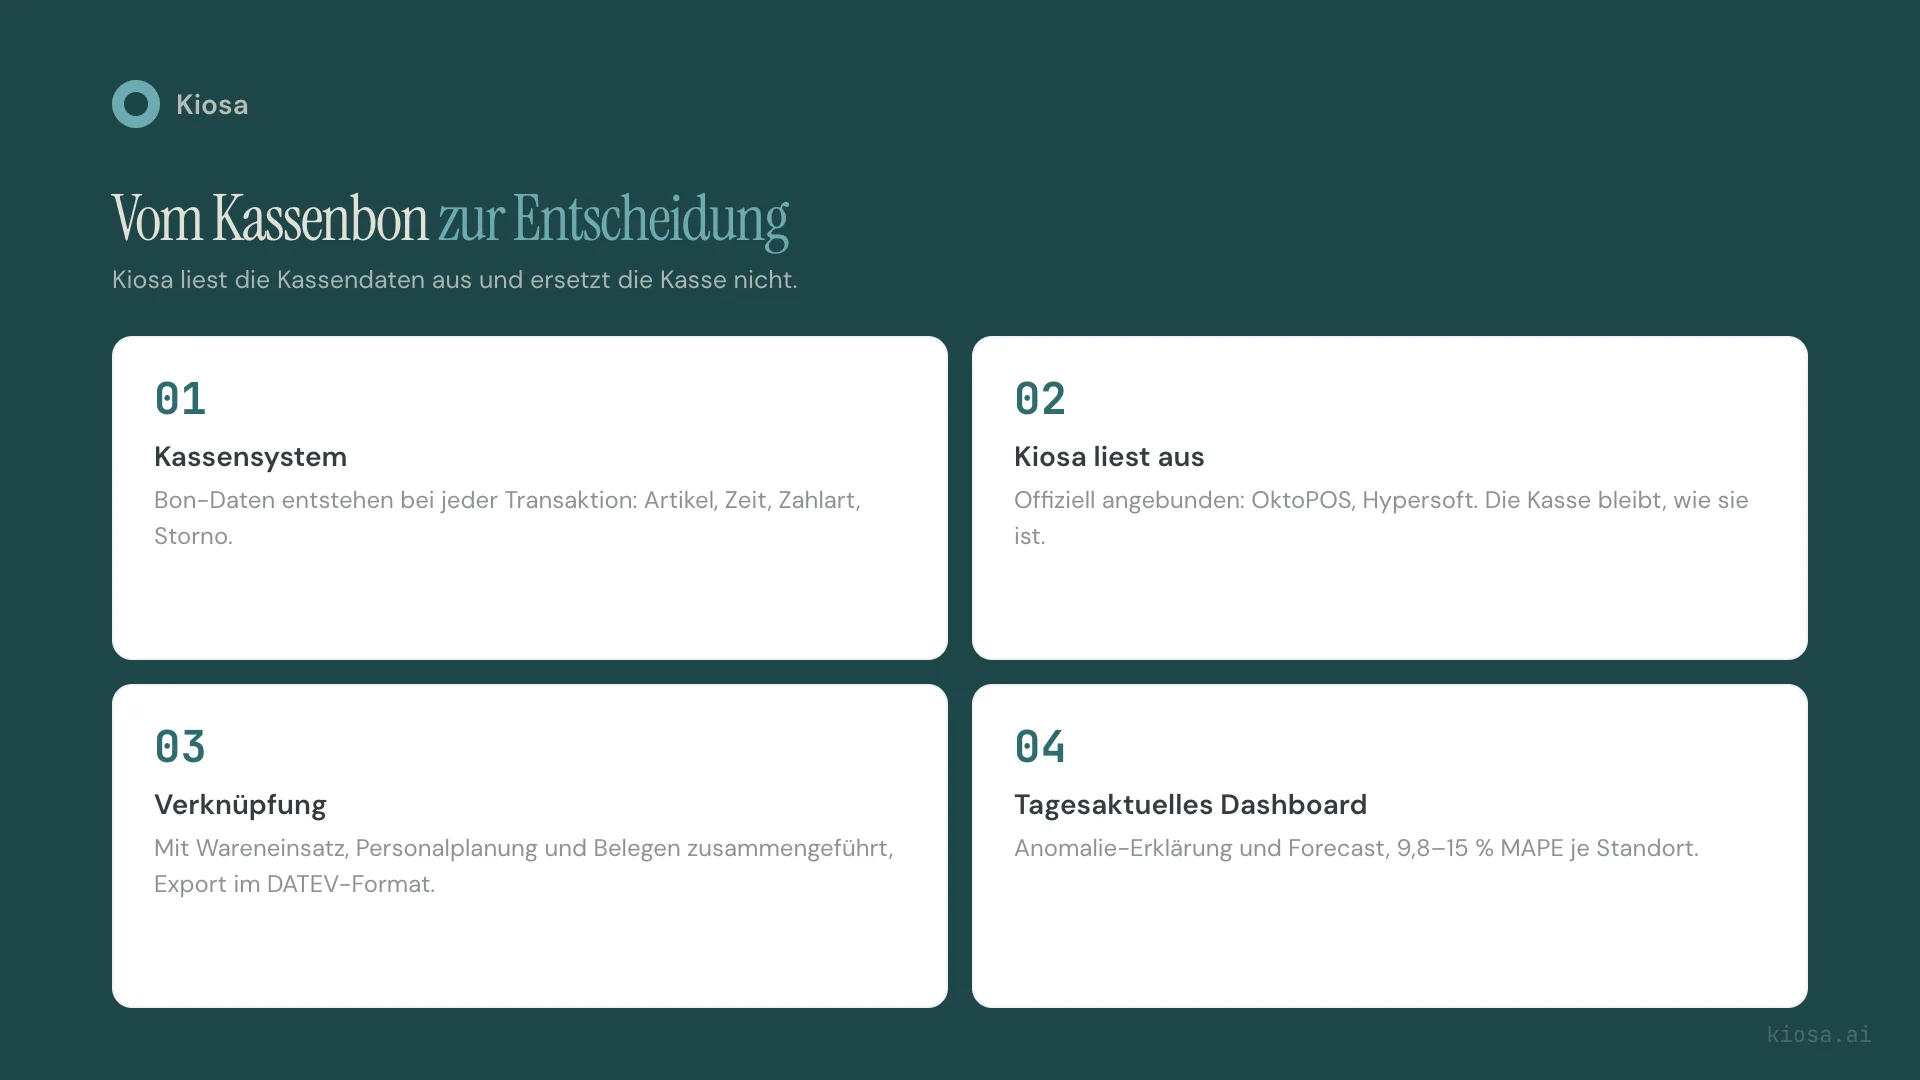
That's exactly what Kiosa does. Kiosa reads the POS data; the officially connected systems are OktoPOS and Hypersoft. It doesn't replace your POS, it connects to it. Check data combined with food cost, labor planning and invoices produces a same-day dashboard instead of a monthly report.
Three things happen automatically that you'd otherwise have to gather by hand:
- POS data is normalised and linked. Even if your POS names items differently from your food cost system, Kiosa matches them, so average check, menu item sales analysis and food cost ratio sit side by side, not in separate tabs.
- Anomalies are explained, not just displayed. A drop in sales is compared against the expected pattern for that weekday and season — including the most likely cause, if there are enough data points.
- A forecast is calculated. Per location, depending on data history and type of location. Public holidays, weather and local events feed into the forecast.
In Kiosa the module for this is called One View — €99 per location per month, no setup fee. If you also want to run food cost control directly in Kiosa, add Inventory for €49; fully built out with Invoices, Loyalty and Scheduling, the total is €445 per location per month. One View is the base; you add the other modules individually and only pay for what you use.
What mistake do most restaurants make when analysing POS data?
The most common mistake I see in multi-location businesses isn't missing software. It's the wrong basis for comparison. Businesses compare today's sales with yesterday — even though Tuesday and Wednesday are structurally different days. Or they compare this month with last month without adjusting for public holidays or season.
The result: a swing that's actually normal gets treated as a problem. And a swing that really is a problem gets lost because last month happened to be similarly bad. Analysing POS data properly doesn't just mean pulling out the right fields. It means setting them against the right expectation — the same weekday four weeks ago, not the calendar day before.
The second common mistake: POS data is looked at location by location, never in comparison. With a single location that still works. As soon as two or more locations are involved, you need the same KPIs, the same definitions, the same periods — otherwise you're not comparing locations, you're comparing different interpretations of the same POS.
Everything on Software selection and costs
- Lightspeed Restaurant Reporting: What Your POS Report Can Do
- Restaurant Scheduling Software: Features and Selection Criteria
- Restaurant Inventory Management System: Cost and When It Pays Off
Related on kiosa.ai:
From analysis to action
What this is about: knowing the data fields on a POS receipt and deriving KPIs and a forecast from them.
Put it into practice: Kiosa One View for POS data, anomalies and forecast
FAQ
What data does a POS system provide for analysis?
A modern POS system provides at least item and quantity, price per line, timestamp and payment method, often also table and server assignment and void/discount flags. These fields are enough for average check, menu item sales analysis, void/discount rate and time patterns — not for food cost, labor cost or forecasting.
Can I analyse POS data without additional software?
Yes, for the basic KPIs. Average check and void/discount rate can be calculated with a CSV export and Excel, if your POS system can export. For same-day analysis across several locations, anomaly explanation and forecasting, doing it by hand quickly becomes a full-time job.
What's the difference between a POS report and controlling?
The POS report shows what happened — sales, payment methods, voids, usually per day or shift. Controlling puts those numbers in context: against the same weekday last year, against food cost, against labor cost. A POS report is a snapshot; controlling is the comparison over time.
Does Kiosa replace my POS system?
No. Kiosa connects to your existing POS system (officially OktoPOS and Hypersoft) and reads the check data, but doesn't replace it. You keep your familiar POS for daily operations; Kiosa takes over controlling, food cost reconciliation and forecasting based on that data.
How accurate is a sales forecast from POS data?
At Kiosa, forecast accuracy depends on the location, data history, type of location and seasonality — the more historical POS data and the more stable the pattern, the more accurate the forecast.
Your next steps
Three steps you can take right away, whatever POS system you have:
- Export one week of POS data and calculate average check and void/discount rate by hand. Compare against the same week four weeks ago, not against the previous week.
- Check whether your POS system has an API or a structured export. That decides how much effort automation will take later.
- Decide which three KPIs you want to see every day — not twenty. Average check, void rate and sales per available seat are a solid start.
With the P&L analyzer you can see in a few minutes how your cost structure compares with the industry — as a first step before you dig deeper into your POS data.
If you want to know how Kiosa combines your POS data with food cost, labor and invoices into a same-day dashboard: book a demo call and we'll look at your POS system together.
Related terms
- Average check — average sales per check or transaction
- Anomaly detection — automatic detection of unusual POS patterns against the expected pattern
- Forecasting — predicting sales and guest numbers from historical POS data
- Food cost ratio — food cost relative to sales
- Table utilization — the ratio of occupied to available seating time
Further reading
- Restaurant sales forecasting: how it works
- Restaurant financial controlling: the daily rhythm
- Menu item sales analysis — rating menu items by sales volume and contribution margin
